 Mir
Mir
Welcome to Mir IoT Hub 🛰️
Build connected devices with Mir, an all battery included platform
Imagine deploying thousands of IoT devices without worrying about message routing, data storage, or real-time monitoring. That’s Mir – a battle-tested IoT platform that handles the complex infrastructure so you can focus on what matters: your devices and data.
🎯 Why Mir?
In the world of IoT, every project starts simple but quickly becomes complex:
- “How do I handle millions of sensor readings per second?”
- “How can I remotely control devices across unreliable networks?”
- “How do I manage device configurations at scale?”
Mir answers these questions with a production-ready platform that scales from your laptop to the cloud.
🚀 What Makes Mir Special?
1. All Batteries Included Platform
Mir includes everything you need to run a production IoT system out of the box:
- Storage: Time-series database for telemetry, graph database for device metadata, and persistent key-value stores for local persistance on devices
- UI & Visualization: Cockpit web interface for device management and fleet monitoring, pre-built Grafana dashboards, powerful CLI with terminal UI, and real-time data streaming views
- Monitoring & Observability: Built-in Prometheus metrics, health checks for all services, and comprehensive event logging
- Developer Tools: Local development, DeviceSDK for device development, ModuleSDK to extend server side capabilities, and virtual device simulators
- Security: TLS encryption and device authentication
- Scalability: Horizontal scaling, load balancing, and clustering support built-in
2. Three Paths to Device Communication
Not all IoT data is created equal. Mir provides purpose-built channels for different needs:
- 🔥 Telemetry: Stream sensor data at lightning speed
- 🔄 Commands: Control devices with guaranteed delivery
- ⚙️ Configuration: Manage device state with digital twins
2. Zero to Development in Minutes
# Start infrastructure
mir infra up

# Launch server
mir serve

# Your IoT platform is ready! 🎉
# Cockpit web UI → http://localhost:3015
# Grafana dashboards → http://localhost:3000
3. Developer-First Experience
- Powerful CLI & TUI: Manage everything from your terminal
- Auto-Generated Dashboards: Visualize data instantly in Grafana
- Type-Safe SDKs: Protocol Buffers prevent integration errors
No need to wire together multiple tools or build custom infrastructure – Mir provides a complete, integrated solution from day one.
4. Built on Giants
- NATS: Ultra-fast messaging backbone
- InfluxDB: Purpose-built for time-series data
- SurrealDB: Graph database for device relationships
- Grafana: Beautiful dashboards out of the box
- Prometheus: System monitoring
🏗️ Real-World Ready
Mir powers IoT solutions across industries:
| Industry | Use Case |
|---|---|
| 🏭 Manufacturing | Monitor equipment health, predict failures, optimize production |
| 🏢 Smart Buildings | Control HVAC, lighting, and security from one platform |
| 🌾 Agriculture | Track soil conditions, automate irrigation, monitor crops |
| 🚛 Logistics | Track fleet location, monitor cargo conditions, optimize routes |
| ⚡ Energy | Monitor grid health, balance load, integrate renewables |
🎯 Perfect For
- Device Developers: Build IoT devices without backend complexity
- System Integrators: Unite diverse device fleets under one API
- DevOps Teams: Deploy and scale with confidence
- Enterprises: Handle millions of devices without breaking a sweat
📚 Your Journey Starts Here
New to Mir?
→ Jump into the Quick Start guide and connect your first device in 5 minutes
Building Devices?
→ Explore the Device SDK to integrate your hardware
Operating at Scale?
→ Check the Operator’s Guide for production deployments
Want to Understand More?
→ Dive into the Architecture Overview for the technical foundation
Welcome to the Mir community! Let’s build the connected future together. 🚀
Overview
Mir Server is a unified IoT platform that provides everything you need to connect, manage, and monitor devices at scale.
Built with a focus on developer experience and production reliability, Mir handles the complex infrastructure so you can focus on your devices and data.
🏗️ Loosely Coupled Architecture
The Mir Server
At its heart, Mir Server is a single, powerful application that orchestrates all IoT operations:
- Unified Gateway: Single entry point for all device connections
- Protocol Management: Handles telemetry, commands, and configuration through optimized channels
- Digital Twin Engine: Maintains virtual representations of all physical devices
- Storage Orchestration: Manages time-series data, device metadata, and configurations
- Real-time Processing: Streams data with sub-millisecond latency
Built as a loosely coupled architecture, each components can scale individually or run as a single unit for easy development and transportability.
📱 Uniform Device Management at Scale
Mir provides a consistent, unified approach to managing thousands of devices, regardless of their type or manufacturer:
Device Organization
- Namespaces: Logical isolation for multi-tenant deployments or organizational units
- Labels & Annotations: Flexible tagging system for device categorization
- Dynamic Groups: Query-based device selection for bulk operations
Fleet Management Capabilities
- Bulk Operations: Execute commands across thousands of devices simultaneously
- Device Templates: Standardized configurations for device types
- Heterogeneous Support: Mix sensors, actuators, gateways in one platform
Management Examples
# Send command to all devices in production namespace
mir cmd send */production -n start_bootup

# Update configuration for all temperature sensors
mir cfg send --label="type=temp-sensor" -n datarate -p '{"interval": 60}'

# Query devices by multiple criteria
mir device list --namespace=factory --label="location=floor-2,status=online"
Scaling Patterns
- Sharding by Namespace: Distribute load across clusters
- Regional Deployment: Devices connect to nearest Mir instance
- Federation: Link multiple Mir deployments for global scale
- Load Balancing: Automatic device distribution across servers
📊 Events & Audit Trail
Mir provides comprehensive event tracking and auditing for compliance, debugging, and operational insights:
Event System
- Automatic Capture: Every device interaction generates an event
- Rich Context: Events include device ID, timestamp, user, action, and outcome
- Real-time Streaming: Subscribe to events as they happen
- Persistent Storage: Long-term retention in database
Audit Capabilities
- Complete History: Full timeline of device lifecycle
- Compliance Ready: Meet regulatory requirements
- Forensic Analysis: Investigate issues with detailed logs
- Custom Retention: Configure retention per event type
Integration Options
- Webhook Notifications: Push events to external systems
- SIEM Integration: Forward to security platforms
- Custom Processors: Build event-driven workflows
- Grafana Dashboards: Visualize event patterns
🔐 Protocol Buffers & Schema Exchange
Schema-First Design
Mir uses Protocol Buffers (protobuf) as its foundation for all communication:
// Device defines its capabilities through schemas

message EnvironmentTlm {
	option (mir.device.v1.message_type) = MESSAGE_TYPE_TELEMETRY;

	mir.device.v1.Timestamp ts = 1 [(mir.device.v1.timestamp) = TIMESTAMP_TYPE_NANO];
	int32 temperature = 2;
	int32 pressure = 3;
	int32 humidity = 4;
	int32 wind_speed = 5;
}

message ActivateHVAC {
	option (mir.device.v1.message_type) = MESSAGE_TYPE_TELECOMMAND;

	int32 duration_sec = 1;
}

message ActivateHVACResp {
  bool success = 1;
}

message DataRateProp {
  option (mir.device.v1.message_type) = MESSAGE_TYPE_TELECONFIG;

  int32 sec = 1;
}

message DataRateStatus {
  int32 sec = 1;
}
Dynamic Schema Exchange
When devices connect, they share their protobuf schemas with Mir Server:
- Device Registration: Device sends its schema definitions
- Schema Validation: Mir validates and stores the schemas
- API Generation: Automatically creates type-safe APIs
- Dashboard Generation: Automatically creates visualization for data
- Documentation: Self-documents all device capabilities
- Version Management: Handles schema evolution gracefully
Benefits:
- Type Safety: Compile-time validation prevents runtime errors
- Self-Documenting: Device capabilities are always clear
- Language Agnostic: Generate SDKs for any language
- Efficient: Binary encoding reduces bandwidth usage
📡 Offline and Local Capabilities
Mir is designed for real-world IoT deployments where connectivity isn’t guaranteed:
Device-Side Features
- Local Storage: Devices buffer data during disconnections
- Automatic Retry: Seamless reconnection when network returns
- Data Prioritization: Critical data sent first upon reconnection
- Conflict Resolution: Handles concurrent offline changes
Server-Side Support
- Digital Twins: Device state persists even when offline
- Command Queuing: Commands wait for device reconnection
- Event Sourcing: Complete history of all device interactions
- Flexible Sync: Devices can sync at their own pace
Offline Patterns
// Device SDK handles offline automatically
device.SendTelemetry(data) // Buffered locally if offline

// Server store config in digital twin and device reconcile on connect
mir.Server().SendConfig().Request(deviceID, properties) // Delivered when device reconnects
🛠️ Developer SDKs
DeviceSDK - Build Connected Devices
The DeviceSDK provides everything you need to integrate your hardware with Mir:
Key Features
- Builder Pattern: Simple, fluent API for device creation
- Automatic Reconnection: Built-in resilience for unreliable networks
- Offline Buffering: Local storage when disconnected
- Schema Validation: Type-safe communication via protobuf
- Multi-Language Support: Currently Go, with Python and C++ coming soon
Device Capabilities
- Stream high-frequency telemetry data
- Respond to real-time commands
- Manage configuration with digital twin sync
- Persistent local storage for reliability
- Built-in health monitoring and metrics
ModuleSDK - Extend Server Capabilities
The ModuleSDK allows you to build custom server-side logic and integrations:
Use Cases
- Custom Business Logic: Process data, trigger alerts, automate workflows
- Third-Party Integrations: Connect to external APIs, services and databases
- Data Processing: Transform, aggregate, or enrich device data
- Custom APIs: Expose specialized endpoints for your applications
- Advanced Analytics: Build complex event processing pipelines
Module Features
- Access to all Mir services (Core, Telemetry, Commands, Config, Events)
- Event-driven architecture with subscriptions
- HTTP API extension capabilities
- Automatic reconnection and error handling
- Full access to device schemas and metadata
- Built-in observability with metrics and logging
Integration Patterns
- Subscribe to device lifecycle events
- Process telemetry streams in real-time
- Trigger actions based on device state changes
- Create custom dashboards and visualizations
- Implement complex authorization rules
📈 Monitoring & Observability
Mir provides comprehensive monitoring capabilities out of the box:
Cockpit Web UI
Cockpit is the Mir web interface, served directly by the Mir server. It provides a browser-based view of the platform without requiring any separate deployment:
- Device Fleet Overview: Browse and inspect connected devices in real time
- Multi-Server Support: Switch between Mir deployments via configurable contexts
- Secure Credential Delivery: Fetch NATS credentials from the server with optional password protection
- Grafana Integration: Launch scoped Grafana views directly from device pages
Built-in Dashboards
- Grafana Integration: Pre-configured dashboards for all telemetry data
- Auto-Generated Views: Dashboards created automatically from device schemas
- Real-time Visualization: Live data streaming with customizable refresh rates
- Multi-Device Views: Compare data across device fleets
Metrics & Health
- Prometheus Metrics: All services expose metrics endpoints
- Device Health Tracking: Monitor connection status, data rates, and errors
- System Performance: Track CPU, memory, network, and storage usage
- Custom Metrics: Add your own metrics via DeviceSDK or ModuleSDK
Alerting Capabilities
- Threshold Alerts: Set limits on any telemetry value
- Anomaly Detection: Identify unusual patterns in device behavior
- Connectivity Alerts: Get notified when devices go offline
- Integration Ready: Connect to PagerDuty, Slack, email, and more
🔒 Security Features
Device Security
- Mutual TLS: Certificate-based authentication
- API Keys: Token-based authentication option
- Device Identity: Unique device fingerprinting
- Secure Enrollment: Zero-touch provisioning
Communication Security
- End-to-End Encryption: TLS 1.3 for all connections
- Message Signing: Prevent tampering
- Perfect Forward Secrecy: Protect past communications
- Certificate Rotation: Automatic renewal
🚀 Deployment Options
Local Development
# Start supporting infrastructure
mir infra up

# Start server
mir serve

# Cockpit web UI → http://localhost:3015
# Grafana dashboards → http://localhost:3000
Production Deployments
Container Deployment
- Docker image ready
- Docker Compose for server and supporting infrastructure
Cloud Native
- Kubernetes-ready with Helm charts
- Auto-scaling based on load
- Multi-region support thanks to NatsIO
🎯 Next Steps
Now that you understand Mir’s architecture:
- Get Started: Follow the Quick Start guide
- Build Devices: Learn the Device SDK
- Deploy: Check the Deployment Guide
- Operate: Read the Operator’s Guide
Quick Start Guide
Get your first IoT device connected in under 5 minutes ⚡
Welcome! This guide will walk you through setting up Mir and connecting your first virtual device. By the end, you’ll understand how to stream telemetry, send commands, and manage device configurations.
📋 Prerequisites
Before we begin, ensure you have:
- Docker installed and running
- Terminal or command prompt access
- 5 minutes of your time
🚀 Installation
Step 1: Download Mir
Download the latest release of Mir from the releases page. From the download, extract the binary. Add it to your path for easier usage.
You can also install the binary via Go (as it is a private repository, follow the access guide):
go install github.com/maxthom/mir/cmds/mir@latest
Step 2: Verify Installation
mir --version
Success! You should see the Mir version information.
🎮 Start Your IoT Platform
Let’s bring up your personal IoT platform in two simple commands:
Terminal 1: Infrastructure
mir infra up
This starts the supporting services.
Terminal 2: Mir Server
mir serve
This launches the Mir server that manages all your devices.
Congratulations! Your IoT platform is now running!
Access Your Interfaces
Cockpit — the Mir web interface for device management:
- URL: http://localhost:3015
Grafana — pre-configured dashboards for telemetry visualization:
- URL: http://localhost:3000
- Username:
admin/ Password:mir-operator
Find the full list of running services here.
🤖 Create Your First Virtual Device
Let’s create a virtual device using the Swarm to see Mir in action:
Terminal 3: Virtual Device
mir swarm --ids power
This creates a virtual “power monitoring” device that simulates:
- Temperature readings
- Power consumption data
- HVAC control capabilities
🔍 Explore Your Device
Terminal 4: View Connected Devices
mir device list
Output:
NAME/NAMESPACE    DEVICE_ID    STATUS    LAST_HEARTBEAT    LABELS
power/default     power        online    Just now
Inspect Device Details
mir device ls power
This displays the device’s digital twin - a complete virtual representation including:
- Metadata (name, namespace, labels)
- Configuration (desired and reported properties)
- Status (online state, schema info)
💬 Communicate with Your Device
Telemetry - Stream Real-time Data
Device sending data to the server in a fire-and-forget manner.
View incoming sensor data:
mir dev tlm list power
Output:
power/default
├─ EnvironmentTlm (temperature, humidity) → View in Grafana
└─ PowerConsumption (watts, voltage) → View in Grafana
Click the Grafana links to see live data visualization!
Commands - Control Your Device
Commands are sent from the server to the device as a request-reply.
See available commands:
mir dev cmd send power
Send a command to activate HVAC:
# See command payload
mir dev cmd send power/default -n swarm.v1.ActivateHVAC -j
# Send command with modified payload
mir dev cmd send power/default -n swarm.v1.ActivateHVAC -p '{"durationSec": 5}'
# Quickly edit and send a command
mir dev cmd send power/default -n swarm.v1.ActivateHVAC -e
Output:
Command sent successfully!
Response: {"success": true}
Configuration - Manage Device State
Configuration is divided into desired properties and reported properties. Contrary to commands, properties use an asynchronous messaging model and are written to storage. They are meant to represent the desired and current state of the device.
View current configuration option:
mir dev cfg send power/default
Update device configuration:
# See current config
mir dev cfg send power/default -n swarm.v1.DataRateProp -c
# See config template payload
mir dev cfg send power/default -n swarm.v1.DataRateProp -j
# Send config with modified payload
mir dev cfg send power/default -n swarm.v1.DataRateProp -p '{"sec": 5}'
# Quickly edit and send a config
mir dev cfg send power/default -n swarm.v1.DataRateProp -e
The device will:
- Receive the new desired configuration
- Apply the changes
- Report back the updated state
🎯 What Just Happened?
In just a few minutes, you’ve:
- ✅ Deployed a complete IoT platform
- ✅ Connected a virtual device
- ✅ Streamed real-time telemetry data
- ✅ Sent commands to control the device
- ✅ Updated device configuration
- ✅ Managed your fleet via Cockpit at
localhost:3015 - ✅ Visualized data in Grafana dashboards at
localhost:3000
🧹 Clean Up
When you’re done experimenting:
# Stop the virtual device (Ctrl+C in Terminal 3)
# Stop Mir server (Ctrl+C in Terminal 2)
# Stop infrastructure
mir infra down
🚦 Next Steps
Now that you’ve experienced Mir’s capabilities:
🔧 Build Real Devices
→ Learn how to integrate your hardware with the Device SDK
📈 Scale Your Deployment
→ Deploy Mir in production with our Deployment Guide
🎨 Customize Your Platform
→ Extend Mir with custom modules using the Module SDK
💡 Explore Advanced Features
→ Master the CLI with our Complete CLI Guide
🎉 Welcome to the Mir community! You’re now ready to build amazing IoT solutions. If you have questions, check our FAQ or join our community.
Concepts
Welcome to the Concepts section! 🚀 This guide will help you understand the fundamental building blocks of Mir IoT Hub and how they work together to create a powerful IoT platform.
Overview
Mir IoT Hub is built on several key concepts that work together to provide a scalable, flexible, and developer-friendly IoT platform:
- Digital Twin - Learn about device representation and state management
- Communication Patterns - Master the telemetry, commands, and configuration communication paths
- Security Model - Understand device authentication and secure communication
Key Principles
1. Device-First Design
Everything in Mir revolves around devices. The platform is designed to make device integration as simple as possible while providing powerful management capabilities.
2. Flexible Communication
Three distinct communication patterns ensure that every use case is covered efficiently:
- Telemetry for high-volume data streaming
- Commands for real-time control
- Configuration for persistent state management
3. Type Safety with Protocol Buffers
All device communication uses Protocol Buffers, providing:
- Type-safe message definitions
- Efficient serialization
- Language-agnostic schemas
- Automatic code generation
4. Modular Architecture
The platform is built using a plugin approach:
- Each component has a specific responsibility
- Easy to scale as needed
- Can be run individually or as a single unit
- Easy to bring custom plugin
5. Developer Experience
From the comprehensive CLI to automatic dashboard generation, Mir prioritizes making developers and operators productive and happy.
Getting Started
Ready to dive deeper? Start with the Overview to understand the platform’s vision and capabilities, then explore each concept to build your understanding.
Each section includes:
- 📖 Conceptual explanations
- 🔧 Practical examples
- 💡 Best practices
- 🎯 Real-world use cases
Let’s begin your journey into the world of Mir IoT Hub!
Digital Twin
The Digital Twin is a fundamental concept in Mir IoT Hub that provides a virtual representation of each physical device. It serves as the single source of truth for device state, configuration, and metadata, enabling powerful management capabilities even when devices are offline.
What is a Digital Twin?
A Digital Twin in Mir is a comprehensive virtual model that mirrors your physical device:
apiVersion: mir/v1alpha
kind: device
meta:
    name: temperature-sensor-01
    namespace: building-a
    labels:
        type: sensor
        location: floor-1
        room: conference-room
    annotations:
        manufacturer: "Acme Sensors Inc"
        installed: "2024-01-15"
spec:
    deviceId: temp-sensor-01
    disabled: false
properties:
    desired:
        sensor.v1.SampleRate:
            intervalSeconds: 60
        sensor.v1.AlertThreshold:
            maxTemp: 25.0
            minTemp: 18.0
    reported:
        sensor.v1.SampleRate:
            intervalSeconds: 60
        sensor.v1.AlertThreshold:
            maxTemp: 25.0
            minTemp: 18.0
        sensor.v1.BatteryStatus:
            percentage: 87
            voltage: 3.2
status:
    online: true
    lastHeartbeat: 2024-11-21T10:30:45Z
    schema:
        packageNames:
            - sensor.v1
            - mir.device.v1
        lastSchemaFetch: 2024-11-21T09:00:00Z
    properties:
        desired:
            sensor.v1.SampleRate: 2024-11-20T14:00:00Z
            sensor.v1.AlertThreshold: 2024-11-19T10:00:00Z
        reported:
            sensor.v1.SampleRate: 2024-11-20T14:05:00Z
            sensor.v1.AlertThreshold: 2024-11-19T10:02:00Z
            sensor.v1.BatteryStatus: 2024-11-21T10:30:00Z
Core Components
1. Metadata (meta)
Device identification and organization:
meta:
    name: temperature-sensor-01      # Human-readable name
    namespace: building-a            # Logical grouping
    labels:                         # Indexed key-value pairs
        type: sensor
        location: floor-1
    annotations:                    # Non-indexed metadata
        notes: "Replaced battery on 2024-10-01"
Best Practices:
- Use descriptive names following a naming convention
- Organize devices into logical namespaces
- Use labels for filtering and searching
- Store additional context in annotations
2. Specification (spec)
Core device configuration:
spec:
    deviceId: temp-sensor-01    # Unique device identifier
    disabled: false             # Enable/disable device
The deviceId is immutable and must be unique across the entire system.
3. Properties
The heart of the Digital Twin pattern - split into desired and reported states:
Desired Properties
Configuration sent from the cloud to the device:
properties:
    desired: # Cloud edit-only property
        sensor.v1.SampleRate:
            intervalSeconds: 60
Reported Properties
Current state reported by the device:
properties:
    reported: # Device edit-only property
        sensor.v1.SampleRate:
            intervalSeconds: 60
        sensor.v1.BatteryStatus:
            percentage: 87
4. Status
Real-time device information maintained by the system:
status:
    online: true
    lastHeartbeat: 2024-11-21T10:30:45Z
    schema:
        packageNames: [sensor.v1]
        lastSchemaFetch: 2024-11-21T09:00:00Z
    properties: # Timestamps of last updates
        desired:
            sensor.v1.SampleRate: 2024-11-20T14:00:00Z
        reported:
            sensor.v1.BatteryStatus: 2024-11-21T10:30:00Z
Property Synchronization Flow
The Digital Twin pattern enables reliable configuration management through a reconciliation process:
1. Users Updates Desired Property
   ┌─────────────┐                                                      ┌─────────────┐
   │    Cloud    │ ─── sensor.v1.SampleRate { intervalSeconds: 30 } ──▶ │   Device    │
   └─────────────┘                                                      └─────────────┘

2. Device Receives Update
   ┌─────────────┐                                                      ┌─────────────┐
   │    Cloud    │ ◀─── Acknowledge Receipt ─────────────────────────── │   Device    │
   └─────────────┘                                                      └─────────────┘

3. Device Applies Configuration
   ┌─────────────┐                                                      ┌─────────────┐
   │    Cloud    │                                                      │   Device    │
   └─────────────┘                                                      │  (updating) │
                                                                        └─────────────┘

4. Device Reports New State
   ┌─────────────┐                                                      ┌─────────────┐
   │    Cloud    │ ◀── sensor.v1.SampleRate { intervalSeconds: 30 } ─── │   Device    │
   └─────────────┘                                                      └─────────────┘

5. Digital Twin Synchronized
   Both desired and reported show same value = ✓ In Sync
Digital Twin Benefits
1. Offline Management
Update device configuration even when it’s offline:
- devices store their properties locally in case of restart while offline
- changes apply when device reconnects
2. Consistent State
Single source of truth for device configuration across your entire fleet.
3. Bulk Operations
Update thousands of devices with a single command using label selectors.
4. Version Control
Track all configuration changes with timestamps and audit trails.
5. Integration Ready
External systems can interact with devices through their digital twins via APIs.
Common Use Cases
Configuration Management
desired:
    wifi.v1.Settings:
        ssid: "IoT-Network"
        channel: 6
Firmware Updates
desired:
    firmware.v1.Update:
        version: "2.1.0"
        url: "https://updates.example.com/v2.1.0"
        checksum: "sha256:..."
Operational Modes
desired:
    device.v1.Mode:
        mode: "maintenance"
        duration: 3600
Feature Flags
desired:
    features.v1.Flags:
        enableAdvancedMetrics: true
        enablePredictiveMaintenance: false
Next Steps
Now that you understand Digital Twins, explore:
- Communication Patterns - How devices sync with their twins
- Device SDK - Implement Digital Twin in your device
- Configuration Guide - Practical configuration examples
The Digital Twin pattern is powerful yet simple - start using it to manage your device fleet more effectively! 🚀
Why Mir Uses Protocol Buffers
Protocol Buffers (protobuf) is at the heart of Mir’s communication architecture. This choice was made after careful consideration of the unique requirements of IoT systems and the need for a robust, efficient, and scalable communication protocol.
1. Compact Binary Format
Protocol Buffers use a variable length binary encoding that dramatically reduces message size compared to JSON or XML:
JSON Example (78 bytes):
{
  "deviceId": "weather-001",
  "timestamp": 1640995200000,
  "temperature": 23.5,
  "humidity": 65.2
}

Protobuf Equivalent (~30 bytes):
[Binary representation - 60% smaller]
Impact: Smaller messages mean reduced bandwidth usage, lower data costs, and faster transmission over cellular networks.
2. High Performance
Protocol Buffers are optimized for speed with minimal CPU overhead:
- Serialization: 3-10x faster than JSON
- Deserialization: 2-5x faster than JSON
- Memory Usage: 2-3x less memory than JSON parsing
Impact: Extends battery life and enables real-time processing on resource-constrained devices or software.
3. Strong Type Safety
Protocol Buffers enforce strict typing at compile-time, preventing runtime errors that could crash devices:
message Telemetry {
  google.protobuf.Timestamp timestamp = 1;
  float temperature = 2;  // Enforced as float, not string
  float humidity = 3;
}
Impact: Reduces debugging time and prevents field failures due to type mismatches.
4. Multi-Language Support
Protocol Buffers generate idiomatic code for all programming languages.
Impact: Enables device development in C/C++, server development in Go, and client applications in Python/JavaScript.
Mir’s Protobuf Architecture
Schema-First Design
Mir enforces a schema-first approach where device capabilities are defined upfront:
// Device schema defines the contract
message WeatherTelemetry {
  option (mir.device.v1.message_type) = MESSAGE_TYPE_TELEMETRY;

  google.protobuf.Timestamp timestamp = 1;
  float temperature = 2;
  float humidity = 3;
  float pressure = 4;
}

message PowerCommand {
  option (mir.device.v1.message_type) = MESSAGE_TYPE_TELECOMMAND;

  bool enable = 1;
}

message DataRateProp {
  option (mir.device.v1.message_type) = MESSAGE_TYPE_TELECONFIG;

  int32 data_rate = 1;
}
Enable discovery of telemetry, commands and configuration by the system to provide a unified management platform.
Allows Mir to generate:
- database query to process and ingest data
- dashboards to visualize telemetry
- commands and configuration discovery
- commands and configuration templates
- and more…
The Protobuf schema approach also allows developers the flexibility of defining the schema they need rather then fix templates as propose by other solution.
The code generation also offer fast development time and offers strong type satefy.
Protobuf Files Management
Mir offers two approaches for managing Protocol Buffer files: the traditional protoc compiler and the modern buf tool. While both work seamlessly with Mir, buf is strongly recommended for new projects due to its superior developer experience and modern workflow.
buf advantages:
- Faster compilation with intelligent caching and parallel processing
- Built-in linting catches common protobuf issues before they become problems
- Dependency management handles external proto dependencies automatically
- Breaking change detection prevents accidental API changes
- Better error messages with clear guidance on how to fix issues
- Simplified configuration with declarative YAML files instead of complex command-line flags
protoc advantages:
- Wider ecosystem support with broader tooling compatibility
- Lower learning curve for teams already familiar with protoc workflows
- Direct control over compilation flags and plugin options
Conclusion
Protocol Buffers provide the perfect balance of performance, safety, and flexibility that IoT systems require. By choosing protobuf, Mir ensures:
- Devices can communicate efficiently with minimal resource usage
- Developers have type safety and excellent tooling support
- Operators can deploy and scale systems with confidence in a uniform platform
- Systems can evolve gracefully as requirements change
The investment in protobuf schema design pays dividends in reduced bugs, improved performance, and simplified operations across the entire IoT ecosystem.
Communication Patterns
Mir IoT Hub implements three distinct communication patterns, each optimized for specific use cases. Understanding these patterns is crucial for building efficient and reliable IoT solutions.
The Three Paths
┌─────────────────────────────────────────────────────────────────┐
│                        Device Communication                     │
├─────────────────┬─────────────────┬─────────────────────────────┤
│   🔥 Telemetry  │  🔄 Commands    │  ⚙️ Configuration           │
├─────────────────┼─────────────────┼─────────────────────────────┤
│ Fire & Forget   │ Request/Reply   │ Desired/Reported State      │
│ High Volume     │ Synchronous     │ Persistent                  │
│ One-way         │ Two-way         │ Eventually Consistent       │
└─────────────────┴─────────────────┴─────────────────────────────┘
Choosing the Right Path
| Aspect | Telemetry | Commands | Config |
|---|---|---|---|
| Direction | Device → Cloud | Cloud ↔ Device | Cloud ↔ Device |
| Acknowledgment | None | Required | Eventually |
| Persistence | Time-series DB | Event log | Digital Twin |
| Use When | Streaming data | Immediate action | Persistent state |
| Offline Behavior | Buffer locally | Fails immediately | Applies when online |
| Examples | Sensor data | Turn on light | Update threshold |
Remember: Choose the right path for each use case, and your IoT solution will be efficient, reliable, and scalable! 🚀
Next Steps
Master these communication patterns to build robust IoT solutions:
🔥 Telemetry
The Hot Path of the system. Designed for high-volume, one-way data streaming from devices to the cloud.
Characteristics
- Fire-and-forget: No acknowledgment required
- High throughput: Optimized for thousands of messages per second
- Batching: Automatic message batching for efficiency
- Time-series storage: Direct pipeline to InfluxDB
- Auto-visualization: Automatic Grafana dashboard generation
Offline Behaviour
If the device becomes offline, all telemetry will be stored locally until reconnection. By default, there is a retention limit of one week of the data on the device. This help prevents the device disk to be fulled and create cascading issues.
How It Works
Device                    Mir                     InfluxDB            Grafana
  │                        │                         │                   │
  ├── Telemetry Batch ────▶│                         │                   │
  │   (Fire & Forget)      ├── Validate Schema       │                   │
  │                        ├── Add Tags/Metadata     │                   │
  │                        ├── Batch Write ─────────▶│                   │
  │                        │                         ├── Store ─────────▶│
  │                        │                         │                   │
Implementation
Schema Definition
message TemperatureTelemetry {
  option (mir.device.v1.message_type) = MESSAGE_TYPE_TELEMETRY;

  int64 ts = 1 [(mir.device.v1.timestamp) = TIMESTAMP_TYPE_NANO];
  double value = 2;
  string unit = 3;
  string location = 4;
}
timestamp field
Each telemetry messages needs a timestamp field specifying the required precision.
TIMESTAMP_TYPE_SEC = 1; // Represents seconds of UTC time since Unix epoch (int64)
TIMESTAMP_TYPE_MICRO = 2; // Represents microseconds of UTC time since Unix epoch (int64)
TIMESTAMP_TYPE_MILLI = 3; // Represents milliseconds of UTC time since Unix epoch (int64)
TIMESTAMP_TYPE_NANO = 4; // Represents nanoseconds of UTC time since Unix epoch (int64)
TIMESTAMP_TYPE_FRACTION = 5; // Represents seconds of UTC time since Unix epoch (int64) and non-negative fractions of a second at nanosecond resolution (int32)
If not specified, the timestamp is applied on the server side.
tags
Tags can be added onto the messages or specific field and add extra information to the data in the database. Tags can be on the entire messages, or the fields.
message TemperatureTelemetry {
  option (mir.device.v1.message_type) = MESSAGE_TYPE_TELEMETRY;

  option (mir.device.v1.meta) = {
    tags: [{
      key: "building"
      value: "A"
    }, {
      key: "floor",
      value: "4"
    }]
  };

  int64 ts = 1 [(mir.device.v1.timestamp) = TIMESTAMP_TYPE_NANO];
  int32 temperature = 2 [(mir.device.v1.field_meta) = {
    tags: [{
      key: "unit",
      value: "celcius"
    }]
  }];
}
Device Side
// Send telemetry - fire and forget
device.Telemetry(&temperature.TemperatureTelemetry{
    Value: 23.5,
    Unit:  "celsius",
    Location: "room-1",
})

// The SDK handles batching automatically
// No need to wait for acknowledgment
See Telemetry
Using the CLI:
mir tlm list <name/namespace>
Open generated panel with Grafana
Use Cases
- High rate telemetry
- Sensor readings: Temperature, humidity, pressure
- Metrics: CPU usage, memory, network stats
- Events: Motion detected, door opened
- Logs: Application logs, debug information
- Location data: GPS coordinates, signal strength
🔄 Commands
The command path enables synchronous, request-response communication for device control.
Characteristics
- Request-response: Every command expects a reply
- Synchronous: Caller waits for execution
- Timeout handling: Configurable command timeouts
- Audit trail: All commands are logged
How It Works
CLI/API                   Mir                     Device
  │                        │                         │
  ├── Send Command ───────▶│                         │
  │                        ├── Validate Permissions  │
  │                        ├── Route to Device ─────▶│
  │                        │                         ├── Execute
  │                        │◀── Command Response ────┤
  │◀── Return Response ────┤                         │
  │                        ├── Log to EventStore     │
Implementation
Schema Definition
message ActivateRelayCmd {
  option (mir.device.v1.message_type) = MESSAGE_TYPE_TELECOMMAND;

    int32 relay_id = 1;
    int32 duration = 2;  // seconds
}

message ActivateRelayResp {
    bool success = 1;
    string message = 2;
}
Device
// Register command handler
device.HandleCommand(
		&schemav1.ActivateRelayCmd{},
		func(msg proto.Message) (proto.Message, error) {
			cmd := msg.(*schemav1.ActivateRelayCmd)

			// Process command ...
			err := hardware.ActivateRelay(cmd.RelayId, cmd.Duration)
      if err != nil {
        return nil, err
      }

			return &schemav1.ActivateRelayResp{
				Success: true,
				Message: fmt.Sprintf("Relay %d activated for %d seconds", cmd.RelayId, cmd.Duration),
			}, nil
		},
	)
Sending Commands
Using the CLI:
mir dev cmd send <name>/<namespace> -n ActivateRelayCmd -p '{"relay_id": 1, "duration": 60}'

# Response
{
  "success": true,
  "message": "Relay 1 activated for 60 seconds"
}
Use Cases
- Actuator control: Turn on/off lights, motors, valves
- Device queries: Get current status, diagnostics
- Configuration changes: Update settings immediately
- Firmware operations: Trigger updates, reboots
- Maintenance: Run diagnostics, calibration
Best Practices
- Validate inputs: Check parameters before execution
- Handle timeouts: Implement proper timeout logic
- Return meaningful errors: Help debugging issues
- Keep it fast: Commands should execute quickly
- Idempotent design: Safe to retry if needed
⚙️ Configuration
The properties reconcile loop is a digital twin pattern for persistent device configuration.
Characteristics
- Desired vs Reported: Separate intended and actual states
- Eventually consistent: Changes apply when device is ready
- Persistent: Survives reboots and disconnections
- Versioned: Track all configuration changes
- Bulk capable: Update many devices at once
How It Works
Updated by operators
Cloud                     Mir                     Device
  │                        │                         │
  ├── Update Desired ─────▶│                         │
  │                        ├── Store in Database     │
  │                        ├── Send Desired ────────▶│
  │                        │                         │
  │                        │                         ├── Update local database
  │                        │                         ├── Call config handlers
  │                        │                         │
  │                        │◀── Send Reported Props ─┤
  │                        ├── Update Digital Twin   │
  │◀── Confirm Sync ───────┤                         │
Device bootup
Device                       Mir
  │   (online)                │
  ├── 1a. Fetch Desired ─────▶│
  │                           │
  │◀── Send Desired Props ────┤
  │                           │
  ├── Update local database   │
  │                           │
  │   (offline)               │
  ├── 1b. Fetch from local    │
  │                           │
  ├── 2. Call config handlers │
Implementation
Schema Definition
// Desired property
message SampleRateConfig {
  option (mir.device.v1.message_type) = MESSAGE_TYPE_TELECONFIG;

    int32 interval_seconds = 1;
}

// Reported property
message SampleRateStatus {
    int32 interval_seconds = 1;
    google.protobuf.Timestamp last_update = 2;
}

// Reported property
message BatteryStatus {
    int32 percentage = 1;
    float voltage = 2;
    bool charging = 3;
}
Device Side:
// Handle a desired property and report
m.HandleProperties(&schemav1.SampleRateConfig{}, func(msg proto.Message) {
	cmd := msg.(*schemav1.SampleRateConfig)
  if desired.IntervalSeconds < 10 {
    return fmt.Errorf("interval too short: %d", desired.IntervalSeconds)
  }

  err := sensor.SetSampleRate(desired.IntervalSeconds)
  if err != nil {
    return err
  }

  if err := m.SendProperties(&schemav1.SampleRateStatus{
      LastUpdate: time.Now(),
      IntervalSeconds: desired.IntervalSeconds,
  }); err != nil {
			m.Logger().Error().Err(err).Msg("error sending data rate status")
	}

  return nil
}

// Report a property directly
if err := m.SendProperties(&schemav1.BatteryStatus{
    Percentage: 87,
    Voltage: 3.2,
    Charging: false,
}); err != nil {
	m.Logger().Error().Err(err).Msg("error sending battery status")
}
Use Cases
- Device settings: Sample rates, thresholds, modes
- Network configuration: WiFi credentials, server URLs
- Feature flags: Enable/disable functionality
- Calibration data: Sensor offsets, scaling factors
- Schedules: Operating hours, maintenance windows
Event and Audit System
The Mir IoT Hub includes a comprehensive event and audit system that provides complete visibility into all system operations, device interactions, and state changes. This system serves as the foundation for monitoring, debugging, and maintaining operational awareness across your infrastructure.
The event system provides a complete audit trail for:
Device Operations
- Track device lifecycle from registration to decommission
- Monitor device connectivity and health status
Command Execution
- Log all commands sent to devices
- Track command execution success/failure
Configuration Management
- Record all configuration updates
- Track desired vs. reported state changes
Event Generation and Subscriptions
The Module SDK provides all the functionnality to both generate new type of events and subscribes to existing ones. Each generated event is captured by the system and stored.
Event Types
System Events
Device Lifecycle Events:
DeviceOnline- Device connects to the systemDeviceOffline- Device disconnects from the systemDeviceCreate- New device registeredDeviceUpdate- Device metadata updatedDeviceDelete- Device removed from system
Command Events:
CommandSent- Command dispatched to deviceCommandReceived- Device acknowledged commandCommandCompleted- Command execution finishedCommandFailed- Command execution failed
Configuration Events:
DesiredPropertiesUpdated- New configuration sent to deviceReportedPropertiesUpdated- Device reported state change
Event Data Structure
# Event metadata
apiVersion: mir.v1
kind: Event
metadata:
  name: device-power-online-12345
  namespace: default
  uid: 01234567-89ab-cdef-0123-456789abcdef
  createdAt: "2025-01-15T10:30:00Z"
# Event specification
spec:
  type: Normal           # Normal or Warning
  reason: DeviceOnline   # Machine-readable reason
  message: "Device power came online"
  payload:               # JSON payload with event details
    deviceId: "power"
    namespace: "default"
    timestamp: "2025-01-15T10:30:00Z"
  relatedObject:         # Reference to related system object
    apiVersion: mir.v1
    kind: Device
    name: power
    namespace: default
# Event status tracking
status:
  count: 1
  firstAt: "2025-01-15T10:30:00Z"
  lastAt: "2025-01-15T10:30:00Z"
Network Resiliency
Network reliability is one of the most critical challenges in IoT systems. Devices operate in unpredictable environments where connectivity can be intermittent, databases may undergo maintenance, and network conditions constantly change. Mir IoT Hub is designed from the ground up to handle these challenges gracefully, ensuring no data is lost and systems continue operating even during disruptions.
Why Network Resiliency Matters
IoT systems face unique connectivity challenges:
- Device Mobility - Devices may move through areas with poor connectivity
- Intermittent Networks - Cellular, Wi-Fi, and other networks can be unreliable
- Database Maintenance - Backend services require updates and maintenance
- Network Partitions - Network infrastructure can fail or become congested
- Power Cycling - Devices may restart unexpectedly
- Resource Constraints - Limited bandwidth, memory, and storage on edge devices
Without proper resiliency, these challenges lead to:
- Lost telemetry data
- Missed commands
- Inconsistent device state
- Manual intervention requirements
- System downtime
Mir addresses these challenges through a multi-layered resilience architecture that provides automatic recovery and graceful degradation.
Three-Layer Resilience Architecture
Mir implements resilience at three complementary layers:
┌─────────────────────────────────────────┐
│ Device Layer                            │
│   Local Storage                         │
│   • Queues messages when offline        │
│   • Configurable persistence policies   │
│   • Local configuration                 │
└─────────────────────────────────────────┘
              ↓ ↑
┌─────────────────────────────────────────┐
│ Transport Layer                         │
│   NATS Message Bus                      │
│   • Automatic reconnection              │
│   • Connection state management         │
└─────────────────────────────────────────┘
              ↓ ↑
┌─────────────────────────────────────────┐
│ Service Layer                           │
│   Database Resilience                   │
│   • TelemetryStore in-memory buffer     │
│   • EventStore in-memory buffer         │
│   • Automatic database reconnection     │
└─────────────────────────────────────────┘
Each layer provides independent resilience, creating a defense-in-depth approach where failures at any level are handled gracefully.
Device Resiliency
The Device SDK provides automatic resilience without requiring changes to your application code. When a device loses connection to the Mir server, the SDK immediately begins automatic reconnection.
While disconnected, devices continue operating normally using local storage. Mir uses an embedded key-value database, to queue messages until connectivity returns. You can choose from three persistence strategies: no storage, store only when offline (default), or always store. Storage limits protect device resources with configurable retention periods (default: 1 week) and disk space caps (default: 85% of disk).
During offline operation, your device continues collecting telemetry, handling commands from cache, and operating with its last known configuration. When connection is restored, the SDK automatically recovers all pending messages in batches, re-synchronizes configuration with the server, and resumes normal operation. This entire process is transparent to your application code—no special handling required.
In regards to device properties, the Device SDK always keep a local copy of the most up to date desired properties in case of reboot and lost of connection.
Key takeaway: Devices never lose data during network disruptions and automatically recover without manual intervention.
For configuration details, see Device Local Configuration.
Server Resiliency
When database connections are lost, services enter degraded mode rather than failing completely. Critical real-time operations like telemetry collection and device communication continue uninterrupted, while administrative functions like queries and management operations are temporarily unavailable. Once connectivity is restored, services automatically return to full functionality and recover all buffered data in the background.
Key takeaway: Infrastructure issues don’t interrupt device communication—services gracefully degrade and automatically recover.
For monitoring and alerting setup, see Monitoring.
Integrating with Mir
Build powerful IoT solutions with Mir’s flexible SDKs 🛠️
Mir provides two powerful SDKs that enable you to build complete IoT solutions: the DeviceSDK for connecting hardware devices, and the ModuleSDK for extending server-side capabilities. Together, they form a comprehensive platform for IoT development.
🎯 Choose Your Integration Path
🔌 DeviceSDK - Connect Your Hardware or Software
Build reliable, scalable device integrations with minimal code. Perfect for:
- IoT device manufacturers
- Software configuration
- Embedded systems developers
- Hardware engineers
- Sensor and actuator integration
🚀 ModuleSDK - Extend the Platform
Add custom business logic and integrations on the server side. Ideal for:
- Integrate with own ERP or databases
- Extend the system with your needs
- Custom workflow builders
🔌 DeviceSDK - Your Device Connection Layer
The DeviceSDK is your gateway to seamlessly connecting IoT devices or software with the Mir platform. It handles all the complexities of device-to-cloud communication, letting you focus on your device’s or software core functionality.
Why DeviceSDK?
Language Independence
- Built on Protocol Buffers for cross-language support
- Currently available for Go
- Python and C/C++ support coming soon
- Clean, idiomatic APIs for each language
Production-Ready Features
- ✅ Automatic reconnection and failover
- ✅ Offline data buffering
- ✅ End-to-end encryption
- ✅ Schema validation
- ✅ Built-in health monitoring
Developer Experience
- Simple, intuitive APIs
- Comprehensive documentation
- Example implementations
- Active community support
🚀 ModuleSDK - Your Server Extension Framework
The ModuleSDK empowers you to extend Mir’s server-side capabilities, enabling powerful integrations and custom business logic that runs alongside the core platform.
Why ModuleSDK?
Seamless Integration
- Direct access to all Mir services
- Event-driven architecture
- Real-time data processing
Enterprise Ready
- ✅ High-performance event streaming
- ✅ Transactional guarantees
- ✅ Horizontal scalability
- ✅ Built-in observability
Flexibility
- Build any custom logic
- Integrate with any system or your databases
- Process data your way
- Deploy independently
📋 Capabilities
1. Event Subscriptions
- Device lifecycle events (connect/disconnect)
- Telemetry data streams
- Command execution results
- Configuration changes
- System health updates
2. Device Operations
- Send commands to any device
- Update device configurations
- Query device states
- Manage device metadata
3. External Integrations
- Database connections
- Third-party APIs
- Message queues
- Cloud services
🎯 Common Use Cases
Business Logic
- Automated device control based on conditions
- Cross-device coordination
- Threshold monitoring and alerting
- Predictive maintenance
Enterprise Integration
- ERP system synchronization
- CRM data enrichment
- Billing and usage tracking
- Compliance reporting
Analytics & ML
- Real-time anomaly detection
- Pattern recognition
- Predictive analytics
- Custom dashboards
Workflow Automation
- Multi-step device operations
- Scheduled tasks
- Event-driven workflows
- Custom approval processes
🤝 Better Together
The true power of Mir emerges when you combine both SDKs:
- DeviceSDK collects and transmits data from your hardware or software
- ModuleSDK processes data and configuration and implements business logic
- Together, they create complete end-to-end IoT solutions
🚦 Next Steps
Ready to start building? Choose your path:
🔌 For Device Developers
→ Jump into the Device SDK Guide to connect your first device
🚀 For Backend Developers
→ Explore the Module SDK Guide to build your first extension
Welcome to the Mir developer community! Let’s build the future of IoT together. 🌟
Getting Started with the Device SDK
Welcome to the Device SDK tutorial! This guide will walk you through building and connecting your first device to the Mir IoT Hub.
🎯 What You’ll Learn
- Core concepts and structure of a Mir device
- How to establish secure device communication
- Implementing telemetry data streaming
- Handling remote commands
- Handling configuration via properties
- Using the Mir CLI to manage your devices
By the end of this tutorial, you’ll have a fully functional device connected to Mir and understand the fundamental patterns for device or software integration.
📋 Prerequisites
Before starting:
- A running instance of the Mir Server
- The Mir CLI tool installed
- Basic familiarity with Go programming
Follow the Running Mir Setup guide to prepare your environment.
🔧 SDK Language Support
Currently, the SDK is available for:
- Go
Coming soon:
- Python
- C/C++
- Additional languages based on community needs
Let’s begin building your first Mir device.
Prerequisites
In this section, we will initialize the project and access the Mir Device SDK.
Make sure you have the Mir Server up & running and the Mir CLI ready to be used. Follow the Running Mir Setup.
Mir tooling
Mir requires a set of utility tools to properly create devices:
- protoc: Protocol buffer compiler.
It must be manually installed via your package manager:
# Debian, Ubuntu, Raspian
sudo apt install protobuf-compiler
# Arch based
sudo pacman -S protobuf
# Mac
brew install protobuf
# Windows
winget install protobuf
The following can be installed via go install or using Mir CLI:
- buf: Modern, fast and efficient Protobuf management
- protoc-go-gen: Go bindings for protobuf compiler
# Mir CLI
mir tools install

# Manually
go install google.golang.org/protobuf/cmd/protoc-gen-go@latest
go install github.com/bufbuild/buf/cmd/buf@latest
Mir utilizes a task runner to run common commands, either justfile or makefile. They are optionnal, but greatly improve the development experience:
- justfile (Preferred): Modern task runner with simpler syntax.
- makefile: Traditional build automation tool.
Yours to install depending on your platform.
Access Mir Device SDK
Go packages are managed in GitHub repository. Since the repository is private, you need to adjust your git configuration before you can execute this line.
go get github.com/maxthom/mir/
Make sure you have access to the repository on GitHub and your local env. is setup with an SSH key for authentication.
First, we need to tell Go to use the SSH protocol instead of HTTPS to access the GitHub repository.
# In ~/.gitconfig
[url "ssh://git@github.com/maxthom/mir"]
  insteadOf = https://github.com/maxthom/mir
Even though packages are stored in Git repositories, they get downloaded through Go mirror. Therefore, we must tell Go to download it directly from the Git repository.
go env -w GOPRIVATE=github.com/maxthom/mir
If any import match the pattern github.com/maxthom/mir/*, Go will download the package directly from the Git repository.
Now, you can run
go get github.com/maxthom/mir/
Ready to roll!
Project template
The Mir CLI provides templates to initialize new projects with a basic layout. Inside the project folder, run the following:
# With Buf (recommended)
mir tools generate device_template github.com/<user/org>/<project>
# With Protoc
mir tools generate device_template --proto=protoc github.com/<user/org>/<project>
# Add --include-container flag to add a Dockerfile and its GitHub pipeline
# -h for more options
Structure
The device template creates a complete Go project structure optimized for Mir development:
project/
├── cmd/
│   └── main.go               # Main application entry point with Mir SDK initialization
├── proto/                    # Protocol Buffer definitions directory
│   ├── mir/
│   │   └── device/
│   │       └── v1/
│   │           └── mir.proto # Mir Device SDK proto definitions
│   └── schema/               # Device-specific schema definitions
│       └── v1/
│           └── schema.proto  # Custom device schema template
├── buf.yaml                  # Buf configuration for proto management
├── buf.gen.yaml              # Buf code generation configuration
├── device.yaml               # Device configuration example
├── makefile                  # Common tasks
├── justfile                  # Common tasks
├── USAGE.md                  # Usage documentation and getting started guide
└── go.mod
makefile/justfile
Common commands to help develop your device
make/just proto: Generates Go code from Protocol Buffer definitions (using buf or protoc)make/just build: Compiles the device binarymake/just run: Runs the device application for development
Choose your prefered task runner and delete the other file.
schema.proto
Device-specific Protocol Buffer schema definitions that define your device’s communication interface for telemetry, commands and configuration.
mir.proto
Mir specific protobuf extentions used by the SDK. This file should not be edited.
device.yaml
Device configuration file with development-ready defaults.
buf.yaml (buf template only)
The buf.yaml file defines a workspace, which represents a directory or directories of Protobuf files that you want to treat as a unit.
buf.gen.yaml (buf template only)
buf.gen.yaml is a configuration file used by the buf generate command to generate integration code for the languages of your choice, in thise case: Go.
Protobuf Files Management
The Mir CLI offers two approaches for managing Protocol Buffer files: the traditional protoc compiler and the modern buf tool. While both work seamlessly with Mir, buf is strongly recommended for new projects due to its superior developer experience and modern workflow.
buf advantages:
- Faster compilation with intelligent caching and parallel processing
- Built-in linting catches common protobuf issues before they become problems
- Dependency management handles external proto dependencies automatically
- Breaking change detection prevents accidental API changes
- Better error messages with clear guidance on how to fix issues
- Simplified configuration with declarative YAML files instead of complex command-line flags
protoc advantages:
- Wider ecosystem support with broader tooling compatibility
- Lower learning curve for teams already familiar with protoc workflows
- Direct control over compilation flags and plugin options
You can specify which approach to use when generating the device template.
Anatomy of a Mir Device
At the core of a device, it is the device unique identifier or deviceId. It is the responsibility of the developers and operators to manage those ids as each deployments or instance must have a unique id.
To begins, lets change the deviceId from example_device to weather in the builder pattern:
package main

import (
	"context"
	"os"
	"os/signal"
	"syscall"

  schemav1 "github.com/maxthom/mir.device.buff/proto/gen/schema/v1"

	"github.com/maxthom/mir/pkgs/device/mir"
)

func main() {
	ctx, cancel := context.WithCancel(context.Background())
	m, err := mir.Builder().
		DeviceId("weather").
		Target("nats://127.0.0.1:4222").
		LogLevel(mir.LogLevelInfo).
		Schema(schemav1.File_schema_v1_schema_proto).
		Build()
	if err != nil {
		panic(err)
	}

	wg, err := m.Launch(ctx)
	if err != nil {
		panic(err)
	}

	osSignal := make(chan os.Signal, 1)
	signal.Notify(osSignal, syscall.SIGINT, syscall.SIGTERM)
	<-osSignal

	cancel()
	wg.Wait()
}
Congratulation, running this code with make/just run or go run cmd/main.go will register a new device to the Mir Server and your journey begins 🚀.
In a separate terminal, run mir device list to see your online device.
Each device is represented in the system by it’s Digital Twin, use mir device list weather/default -o yaml to see yours:
apiVersion: mir/v1alpha
kind: device
meta:
    name: weather
    namespace: default
    labels: {}
    annotations: {}
spec:
    deviceId: weather
    disabled: false
properties: {}
status:
    online: false
    lastHeartbeat: 2024-11-15T20:01:19.296494766Z
    schema:
        packageNames:
            - google.protobuf
            - mir.device.v1
        lastSchemaFetch: 2024-11-15T20:00:03.604338288Z
- Name: The device arbritary name, this can be renamed at any time to be more friendly.
- Namespace: To organize devices in different groups.
- Labels: KeyValue pairs. To add identifying data to the device. Indexed by the system.
- Annotations: KeyValue pairs. To add metadata to the device. Not indexed by the system.
- DeviceId: The unique identifier of the device. This is the only required field.
- Disabled: The device will not be able to communicate with the server.
- Properties: Used to configure desired an reported properties of the device.
- Status: System information about the status of the device.
! Note: Name and Namespace form a composable unique key while deviceId is unique.
! Note: When autoprovisionning a device, meaning the device was not created beforehand in the system, the device is automatically set in the default namespace and use the deviceId for name.
You can use mir device edit weather/default to interactively edit the device twin.
Rename it, change its namespace, add labels, etc. Only the Meta, Spec and Properties can be edited. Status is reserved for the system or extensions.
The CLI offers many commands to interact with devices. Yours to explore 🛰️.
Device Communication
The SDK provides a set of functions to interact with the Mir server. There are 3 types of communication:
- Telemetry: data are sent from the device to the server as fire and forget.
- Commands: data are sent from the server to the device with a reply expected.
- Configuration: data is exchange between the server and the device in an asynchronous way. Used to configure the device and report the current status.
See Communicaton.
To provice a great developper experience and high performance, Mir utilizes Protocol Buffer to define the communication schema. On top of Protobuf, Mir provide a predefined schema to annotate Protobuf messages with metadata to help the server understand the type of data. See Mir Protobuf.
Editing the Schema
For this next part, we will define a schema to enable communication between your device and the server.
mir.proto: contains Mir metadata and Protobuf extentions. Readonly.schema.proto: contains your device schema and defines the communication interface.
syntax = "proto3";

package schema.v1;
option go_package = "github.com/maxthom/mir.device.buff/proto/schema/v1/schemav1";

import "mir/device/v1/mir.proto";
You can also remove the rest of the schema as we will recreate it during the tutorial.
When you are ready, generate the go code:
just proto
#or
make proto
You should see a new file containing the generated code: proto/schema/v1/schema.pb.go
Pass the Schema to Mir
Back in your main.go, you must import and add the proto schema to the MirSDK:
package main

import (
	"context"
	"os"
	"os/signal"
	"syscall"

	"github.com/maxthom/mir/pkgs/device/mir"
	schemav1 "github.com/maxthom/mir.device.buff/proto/gen/schema/v1"
)

func main() {
	ctx, cancel := context.WithCancel(context.Background())
	m, err := mir.Builder().
		DeviceId("weather").
		Target("nats://127.0.0.1:4222").
		LogLevel(mir.LogLevelInfo).
		Schema(schemav1.File_schema_v1_schema_proto).
		Build()
	if err != nil {
		panic(err)
	}

	wg, err := m.Launch(ctx)
	if err != nil {
		panic(err)
	}

	osSignal := make(chan os.Signal, 1)
	signal.Notify(osSignal, syscall.SIGINT, syscall.SIGTERM)
	<-osSignal

	cancel()
	wg.Wait()
}
Protobuf needs a bit of getting used to, but it is a powerful tool. The generated code will help you interact with the server in a type safe way, give high performance and provide a great developper experience.
🥳 Congratulation! You have generated your schema and Mir is now aware of it.
If you run the code again and run mir dev ls weather -o yaml, you should see the schema in the digital twin status section:
schema:
  packageNames:
    - google.protobuf
    - mir.device.v1
    - schema.v1
    lastSchemaFetch: "2025-07-18T10:52:07.664623316Z"
From this point on, everything is setup to start building!
Device Telemetry
Device telemetry is the most common way to send data from the device to the server. This is the hot path and is used to send data that does not require a reply. This type of data is of timeseries as each datapoint sent is attached to a timestamp of different precision (you choose on your needs). The Mir telemetry module will ingest and store it in InfluxDB:
InfluxDB is a time series database designed to handle high write and query loads. InfluxDB is meant to be used as a backing store for any use case involving large amounts of timestamped data, including DevOps monitoring, application metrics, IoT sensor data, and real-time analytics.
Editing the Schema
First, lets define a telemetry message in your schema:
message Env {
	option (mir.device.v1.message_type) = MESSAGE_TYPE_TELEMETRY;

	int64 ts = 1 [(mir.device.v1.timestamp) = TIMESTAMP_TYPE_NANO];
	int32 temperature = 2 [(mir.device.v1.field_meta) = { unit: "C" }];
	int32 pressure = 3 [(mir.device.v1.field_meta) = { unit: "kPA" }];
	int32 humidity = 4 [(mir.device.v1.field_meta) = { unit: "%" }];
}
Here we define a message Env that will be used. The options are used to annotate the message with metadata:
mir.device.v1.message_type: This tell the server that this message is of telemetry type.mir.device.v1.timestamp: This tell the server that the fieldtsis the main timestamp and the precision is NANOSECONDS. Second, Microsecond and Millisecond are also available.mir.device.v1.field_meta: This tell the server the unit of the field so it can be used for telemetry visualization.
Lets regenerate the schema:
just proto
#or
make proto
Send Telemetry to Mir
Let’s create a function that send telemetry data to the server every 3 seconds.
To do so, we use the m.SendTelemetry function that take any proto message:
package main

import (
	"context"
	"math/rand/v2"
	"mir-device/schemav1"
	"os"
	"os/signal"
	"syscall"
	"time"

	"github.com/maxthom/mir/pkgs/device/mir"
	schemav1 "github.com/maxthom/mir.device.buff/proto/gen/schema/v1"
)

func main() {
	ctx, cancel := context.WithCancel(context.Background())
	m, err := mir.Builder().
		DeviceId("weather").
		Target("nats://127.0.0.1:4222").
		LogPretty(false).
		Schema(schemav1.File_schema_proto).
		Build()
	if err != nil {
		panic(err)
	}

	wg, err := m.Launch(ctx)
	if err != nil {
		panic(err)
	}
	dataRate := 3

  // Start go routine for not to block main thread
	go func() {
		for {
			select {
			case <-ctx.Done():
				// If context get cancelled, stop sending telemetry and
				// decrease the wait group for graceful shutdown
				wg.Done()
				return
			case <-time.After(time.Duration(dataRate) * time.Second):
				if err := m.SendTelemetry(&schemav1.Env{
					Ts:          time.Now().UTC().UnixNano(),
					Temperature: rand.Int32N(101),
					Pressure:    rand.Int32N(101),
					Humidity:    rand.Int32N(101),
				}); err != nil {
					m.Logger().Error().Err(err).Msg("error sending telemetry")
				}
			}
		}
	}()

	osSignal := make(chan os.Signal, 1)
	signal.Notify(osSignal, syscall.SIGINT, syscall.SIGTERM)
	<-osSignal

	cancel()
	wg.Wait()
}
Run the project:
just run
#or
make run
Visualize the Data
Just like that, we now have telemetry that is stored server side
mir dev tlm list weather

1. weather/default
schema.v1.Env{} localhost:3000/explore
Click on the link to open Grafana and visualize the data. The default user/password is:
user: admin
password: mir-operator
You can also see the data in InfluxDB:
localhost:8086
user: admin
password: mir-operator
Voila! You have successfully sent telemetry data to the server. Add more message to the schema and send more data! Use the CLI to quickly get link to the telemetry data in Grafana and use the generated query to create powerful dashboard.
! Note: All protobuf definition are supported except OneOf
Device Commands
Device commands are request-reply messages from the server to a set of devices.
Editing the Schema
You must define two protobuf messages per command: one for the request and one for the reply.
Let’s add a command to our example to activate a HVAC system. First, let’s define them in the schema:
message ActivateHVACCmd {
	option (mir.device.v1.message_type) = MESSAGE_TYPE_TELECOMMAND;

	int32 duration_sec = 1;
}

message ActivateHVACResp {
  bool success = 1;
}
As you can see, instead of having the option as MESSAGE_TYPE_TELEMETRY, it is now MESSAGE_TYPE_TELECOMMAND.
This will tell the server that this message is a command and should be handled as such. The response does not need any special annotation.
Let’s regenerate the schema:
just proto
# or
make proto
Handle the Command
Each command takes a callback function that will be called when the server sends a command to the device:
m.HandleCommand(
	&schemav1.ActivateHVACCmd{},
	func(msg proto.Message) (proto.Message, error) {
		cmd := msg.(*schemav1.ActivateHVACCmd) // Cast the proto.Message to the command type

		/* Command processing...*/

  	// Return the command response. This can be any proto message.
   	// You can also return an error instead that will be pass back to the server and requester.
    return &schemav1.ActivateHVACResp{
    	Success: true,
    }, nil
})
Let’s complete our example by adding a command handler that output some logs after the duration:
package main

import (
	"context"
	"math/rand/v2"
	"mir-device/schemav1"
	"os"
	"os/signal"
	"syscall"
	"time"

	"github.com/maxthom/mir/pkgs/device/mir"
	schemav1 "github.com/maxthom/mir.device.buff/proto/gen/schema/v1"
	"google.golang.org/protobuf/proto"
)

func main() {
	ctx, cancel := context.WithCancel(context.Background())
	m, err := mir.Builder().
		DeviceId("weather").
		Target("nats://127.0.0.1:4222").
		LogPretty(false).
		Schema(schemav1.File_schema_proto).
		Build()
	if err != nil {
		panic(err)
	}

	wg, err := m.Launch(ctx)
	if err != nil {
		panic(err)
	}
	dataRate := 3

	m.HandleCommand(
		&schemav1.ActivateHVACCmd{},
		func(msg proto.Message) (proto.Message, error) {
			cmd := msg.(*schemav1.ActivateHVACCmd)
			m.Logger().Info().Msgf("handling command: activating HVAC for %d sec", cmd.DurationSec)

			go func() {
				<-time.After(time.Duration(cmd.DurationSec) * time.Second)
				m.Logger().Info().Msg("turning off HVAC")
			}()

			return &schemav1.ActivateHVACResp{
				Success: true,
			}, nil
		})

	go func() {
		for {
			select {
			case <-ctx.Done():
				wg.Done()
				return
			case <-time.After(time.Duration(dataRate) * time.Second):
				if err := m.SendTelemetry(&schemav1.Env{
					Ts:          time.Now().UTC().UnixNano(),
					Temperature: rand.Int32N(101),
					Pressure:    rand.Int32N(101),
					Humidity:    rand.Int32N(101),
				}); err != nil {
					m.Logger().Error().Err(err).Msg("error sending telemetry")
				}
			}
		}
	}()

	osSignal := make(chan os.Signal, 1)
	signal.Notify(osSignal, syscall.SIGINT, syscall.SIGTERM)
	<-osSignal

	cancel()
	wg.Wait()
}
Rerun the code:
just run
# or
make run
Send a Command
Our device is now sending periodic telemetry and can receive one command. Let’s test it:
# List all available commands
mir dev cmd send weather
  schema.v1.ActivateHVACCmd{}

# Show command JSON template for payload
mir cmd send weather/default -n schema.v1.ActivateHVACCmd -j
  {
    "durationSec": 0
  }
Multiple ways to send a command:
# Send command to activate the HVAC
# ps: use single quotes for easy json
mir cmd send weather/default -n schema.v1.ActivateHVACCmd -p '{"durationSec": 5}'
  1. weather/default COMMAND_RESPONSE_STATUS_SUCCESS
  schema.v1.ActivateHVACResp
  {
    "success": true
  }

# Use pipes to pass payload
mir cmd send weather/default -n schema.v1.ActivateHVACCmd -j > ActivateHVACCmd.json
# Edit ActivateHVACCmd.json
# Send it!
cat ActivateHVACCmd.json | mir cmd send weather/default -n schema.v1.ActivateHVACCmd
  1. weather/default COMMAND_RESPONSE_STATUS_SUCCESS
  schema.v1.ActivateHVACResp
  {
    "success": true
  }

# Interactively edit for easy interaction
# Upon quit and save, it will send the command
mir cmd send weather/default -n schema.v1.ActivateHVACCmd -e
  1. weather/default COMMAND_RESPONSE_STATUS_SUCCESS
  schema.v1.ActivateHVACResp
  {
    "success": true
  }
Voila! You have successfully sent a command to the device to change it’s data rate. Look at your device logs to see the command into effect.
Device Configuration
Device configuration is a messaging flow that allows each devices to have a state. This state is saved:
- on the server’s database
- on the device local storage to enable offline workflow
The configuration or properties are divided into two components: desired properties and reported properties.
- Desired properties are sent to the server from a client, written to storage and sent to devices.
- Reported properties are sent from the device to the server and are stored in the server’s storage.
- Can be sent after handling a desired propertie
- Can be sent as standalone to report a status
Let’s add properties to change the telemetry data rate and another one to report on the HVAC status.
Editing the Schema
Let’s add some desired and reported properties:
message DataRateProp {
  option (mir.device.v1.message_type) = MESSAGE_TYPE_TELECONFIG;

  int32 sec = 1;
}

message DataRateStatus {
  int32 sec = 1;
}

message HVACStatus {
   bool online = 1;
}
You can see the new proto annotation: MESSAGE_TYPE_TELECONFIG. Regenerate the schema:
just proto
# or
make proto
Handle the DataRate Properties
As commands, each desired property takes a callback function that is called when the property is updated. Contrary to commands, each desired property is stored on the device local storage ensuring proper functionality in case of network issues.
On device boot up, the device request all it’s desired properties from the server. If it can’t receives them, it will use it’s local storage. Each handler will always be called on device start up to help initialization.
Let’s update the data rate property to our device:
	m.HandleProperties(&schemav1.DataRateProp{}, func(msg proto.Message) {
			cmd := msg.(*schemav1.DataRateProp)
			if cmd.Sec < 1 {
				cmd.Sec = 1
			}
			dataRate = int(cmd.Sec)
			m.Logger().Info().Msgf("data rate changed to %d", dataRate)

			if err := m.SendProperties(&schemav1.DataRateStatus{Sec: cmd.Sec}); err != nil {
				m.Logger().Error().Err(err).Msg("error sending data rate status")
			}
		})
We can now receive one desired property and the device sends one reported property to confirm the current data rate. Reported properties can be the same as the desired or entirely different.
just run
# or
make run
Update the property
Let’s test:
# List all available config
mir dev cfg send weather
  schema.v1.DataRateProp{}

# Show config current values
mir cfg send weather/default -n schema.v1.DataRateProp -c
  {
    "sec": 0
  }

# Send config to change data rate to 5 seconds
mir cfg send weather/default -n schemav1.DataRateProp -e
  schemav1.DataRateProp
  {
    "sec": 5
  }
The config cli works the same to the commands cli.
Let’s take a look at the device twin mir dev ls weather/default:
apiVersion: mir/v1alpha
kind: device
meta:
name: weather
...
properties:
  desired:
      schema.v1.DataRateProp:
          sec: 5
  reported:
      schema.v1.DataRateStatus:
          sec: 5
      schema.v1.HVACStatus:
          online: false
status:
...
  properties:
      desired:
          schema.v1.DataRateProp: 2025-02-15T17:01:25.686135311Z
      reported:
          schema.v1.DataRateStatus: 2025-02-15T17:01:25.689587722Z
Under properties, we see the current desired and reported properties. Moreover, under status.properties, we see at what time each property were last updated in UTC.
! You can also update desired properties editing the twin using the different device update commands mir dev edit weather
Report the HVAC Status
To complete the example, let’s add a HVAC status properties in the activate command:
	m.HandleCommand(
		&schemav1.ActivateHVACCmd{},
		func(msg proto.Message) (proto.Message, error) {
			cmd := msg.(*schemav1.ActivateHVACCmd)
			m.Logger().Info().Msgf("handling command: activating HVAC for %d sec", cmd.DurationSec)
			// Report HVAC is online
			if err := m.SendProperties(&schemav1.HVACStatus{Online: true}); err != nil {
				m.Logger().Error().Err(err).Msg("error sending HVAC status")
			}

			go func() {
				<-time.After(time.Duration(cmd.DurationSec) * time.Second)
				m.Logger().Info().Msg("turning off HVAC")
				// Report HVAC is offline
				if err := m.SendProperties(&schemav1.HVACStatus{Online: false}); err != nil {
					m.Logger().Error().Err(err).Msg("error sending HVAC status")
				}
			}()

			return &schemav1.ActivateHVACResp{
				Success: true,
			}, nil
		})
Voila! We now have a status report if the HVAC is online and offline.
just run
# or
make run
Send HVAC command
# Send ActivateHVAC command to the device
mir cmd send weather_hvac -n schema.v1.ActivateHVACCmd -p '{"durationSec":10}'
# Display the twin to see HVAC status online
mir dev ls weather
# Wait 10 seconds, display the twin to see HVAC status offline
mir dev ls weather
You should see the updated properties in digital twin mir dev ls weather:
properties:
    desired:
        schema.v1.DataRateProp:
            sec: 5
    reported:
        schema.v1.DataRateStatus:
            sec: 5
        schema.v1.HVACStatus:
            online: true
After 10 seconds:
properties:
    desired:
        schema.v1.DataRateProp:
            sec: 5
    reported:
        schema.v1.DataRateStatus:
            sec: 5
        schema.v1.HVACStatus:
            online: false
Complete Code
package main

import (
	"context"
	"math/rand/v2"
	"os"
	"os/signal"
	"syscall"
	"time"

	schemav1 "github.com/maxthom/mir.device.buff/proto/gen/schema/v1"
	"github.com/maxthom/mir/pkgs/device/mir"
	"google.golang.org/protobuf/proto"
)

func main() {
	ctx, cancel := context.WithCancel(context.Background())
	m, err := mir.Builder().
		DeviceId("weather").
		Target("nats://127.0.0.1:4222").
		LogLevel(mir.LogLevelInfo).
		Schema(schemav1.File_schema_v1_schema_proto).
		Build()
	if err != nil {
		panic(err)
	}

	wg, err := m.Launch(ctx)
	if err != nil {
		panic(err)
	}
	dataRate := 3

	m.HandleCommand(
		&schemav1.ActivateHVACCmd{},
		func(msg proto.Message) (proto.Message, error) {
			cmd := msg.(*schemav1.ActivateHVACCmd)
			m.Logger().Info().Msgf("handling command: activating HVAC for %d sec", cmd.DurationSec)
			if err := m.SendProperties(&schemav1.HVACStatus{Online: true}); err != nil {
				m.Logger().Error().Err(err).Msg("error sending HVAC status")
			}

			go func() {
				<-time.After(time.Duration(cmd.DurationSec) * time.Second)
				m.Logger().Info().Msg("turning off HVAC")
				if err := m.SendProperties(&schemav1.HVACStatus{Online: false}); err != nil {
					m.Logger().Error().Err(err).Msg("error sending HVAC status")
				}
			}()

			return &schemav1.ActivateHVACResp{
				Success: true,
			}, nil
		})

	m.HandleProperties(&schemav1.DataRateProp{}, func(msg proto.Message) {
		cmd := msg.(*schemav1.DataRateProp)
		if cmd.Sec < 1 {
			cmd.Sec = 1
		}
		dataRate = int(cmd.Sec)
		m.Logger().Info().Msgf("data rate changed to %d", dataRate)

		if err := m.SendProperties(&schemav1.DataRateStatus{Sec: cmd.Sec}); err != nil {
			m.Logger().Error().Err(err).Msg("error sending data rate status")
		}
	})

	go func() {
		for {
			select {
			case <-ctx.Done():
				// If context get cancelled, stop sending telemetry and
				// decrease the wait group for graceful shutdown
				wg.Done()
				return
			case <-time.After(time.Duration(dataRate) * time.Second):
				if err := m.SendTelemetry(&schemav1.Env{
					Ts:          time.Now().UTC().UnixNano(),
					Temperature: rand.Int32N(101),
					Pressure:    rand.Int32N(101),
					Humidity:    rand.Int32N(101),
				}); err != nil {
					m.Logger().Error().Err(err).Msg("error sending telemetry")
				}
			}
		}
	}()

	osSignal := make(chan os.Signal, 1)
	signal.Notify(osSignal, syscall.SIGINT, syscall.SIGTERM)
	<-osSignal

	cancel()
	wg.Wait()
}
Voila! You have set up desired and reported properties for your device. They are powerful tools that allow you to control and monitor your device’s behavior.
Device Configuration
This guide covers all the ways to configure a Mir device, including the builder pattern, YAML configuration files, and environment variables. Understanding these options allows you to flexibly configure devices for different deployment scenarios.
Configuration Methods
There are three ways to configure a Mir device:
- Builder Pattern - Programmatic configuration in code
- YAML Configuration File - External configuration file
- Environment Variables - System environment variables
These methods can be combined, with the following priority order (highest to lowest):
Builder Pattern > YAML Config > Environment Variables > Defaults
Builder Pattern
The builder pattern provides a fluent API for configuring devices programmatically. This is the most flexible approach and is useful when configuration needs to be dynamic, computed at runtime or local development.
Basic Usage
m, err := mir.Builder().
    DeviceId("weather-sensor-01").
    Target("nats://mir.example.com:4222").
    LogLevel(mir.LogLevelInfo).
    Build()
Note:
- Device IDs cannot contain these reserved characters:
*,>,.- DeviceID must be unique per instance, better to use configuration file for it
Adding Device ID Prefix
Add a prefix to your device ID for organizational purposes:
// Using custom prefix
m, err := mir.Builder().
    DeviceId("sensor-01").
    DeviceIdPrefix(mir.IdPrefix{
        Prefix: "warehouse-a",
    }).
    Build()
// Result: "warehouse-a_sensor-01"

// Using hostname as prefix
m, err := mir.Builder().
    DeviceId("sensor-01").
    DeviceIdPrefix(mir.IdPrefix{
        Hostname: true,
    }).
    Build()
// Result: "myhost_sensor-01"
Logging
Configure logging behavior for debugging and monitoring.
m, err := mir.Builder().
    LogLevel(mir.LogLevelDebug).
    LogPretty(true). // Enable colors
    Build()
Custom Log Writers
// Single custom writer
logFile, _ := os.Create("device.log")
m, err := mir.Builder().
    LogWriter(logFile).
    Build()

// Multiple writers (console + file)
m, err := mir.Builder().
    LogWriters([]io.Writer{
        os.Stdout,
        logFile,
    }).
    Build()
Schema Management
Register Protocol Buffer schemas for telemetry and commands.
Registering Schemas
import schemav1 "mydevice/proto/gen/schema/v1"

m, err := mir.Builder().
    Schema(schemav1.File_schema_v1_schema_proto).
    Build()
Multiple Schemas
m, err := mir.Builder().
    Schema(
        schemav1.File_schema_v1_temperature_proto,
        schemav1.File_schema_v1_humidity_proto,
        schemav1.File_schema_v1_commands_proto,
    ).
    Build()
Configuration File
Load configuration from external files.
Default Configuration File
m, err := mir.Builder().
    DefaultConfigFile().
    Build()
Default config file search order:
./device.yaml~/.config/mir/device.yaml/etc/mir/device.yaml
Custom Configuration File
// YAML file
m, err := mir.Builder().
    ConfigFile("/path/to/config.yaml", mir.ConfigFormatYAML).
    Build()

// JSON file
m, err := mir.Builder().
    ConfigFile("/path/to/config.json", mir.ConfigFormatJSON).
    Build()
Local Persistence
Configure local message storage for offline operation. Mir DeviceSDK handles local persistence in case of disconnected from the server. If disconnected, all messages, telemetry and configuration is written to disk until reconnnect. Upon reconnection, all stored messages is sent to the server and local configuration is synchronized.
m, err := mir.Builder().
    Store(mir.StoreOptions{
        FolderPath:       ".store/",
        RetentionLimit:   time.Hour * 168, // 1 week
        DiskSpaceLimit:   85,              // 85% max disk usage
        PersistenceType:  mir.PersistenceIfOffline,
        InMemory: false,
    }).
    Build()
StoreOptions Fields:
PersistenceType(string) - Storage strategy:mir.PersistenceNoStorage- No message storagemir.PersistenceIfOffline- Store only when disconnected (default)mir.PersistenceAlways- Store all messages
Authentication & Security
Configure authentication and TLS encryption for secure communication.
JWT Authentication
// Using default credential file locations
m, err := mir.Builder().
    DefaultUserCredentialsFile().
    Build()

// Or specify custom path
m, err := mir.Builder().
    UserCredentialsFile("/path/to/device.creds").
    Build()
Default credential file search order:
./device.creds~/.config/mir/device.creds/etc/mir/device.creds
TLS Server Verification (Server-Only TLS)
// Using default RootCA locations
m, err := mir.Builder().
    DefaultRootCAFile().
    Build()

// Or specify custom path
m, err := mir.Builder().
    RootCAFile("/path/to/ca.crt").
    Build()
Default RootCA file search order:
./ca.crt~/.config/mir/ca.crt/etc/mir/ca.crt
Mutual TLS (mTLS)
// Using default certificate locations
m, err := mir.Builder().
    DefaultClientCertificateFile().
    DefaultRootCAFile().
    Build()

// Or specify custom paths
m, err := mir.Builder().
    ClientCertificateFile("/path/to/tls.crt", "/path/to/tls.key").
    RootCAFile("/path/to/ca.crt").
    Build()
Default client certificate search order:
Certificate:
./tls.crt~/.config/mir/tls.crt/etc/mir/tls.crt
Key:
./tls.key~/.config/mir/tls.key/etc/mir/tls.key
Configuration File
This is ideal for production deployments where configuration should be external to the code.
File Locations
The device searches for configuration files in this order if using DefaultConfigFile() options:
./device.yaml- Current directory~/.config/mir/device.yaml- User config directory/etc/mir/device.yaml- System-wide config
mir:
  # Server connection
  target: "nats://127.0.0.1:4222"

  # Authentication (optional)
  credentials: ""  # Path to JWT credentials file
  rootCA: ""       # Path to RootCA certificate
  tlsCert: ""      # Path to client TLS certificate
  tlsKey: ""       # Path to client TLS key

  # Logging
  logLevel: "info"  # [trace|debug|info|warn|error|fatal]

  # Device identity
  device:
    id: "my-device"  # Required if no idGenerator

    # Optional: Add prefix to device ID
    idPrefix:
      prefix: ""       # Custom prefix string
      hostname: false  # Use hostname as prefix
      username: false  # Use username as prefix

    noSchemaOnBoot: false  # Don't send schema on connection

  # Local message storage
  localStore:
    folderPath: ""              # Storage directory
    inMemory: false             # Use in-memory storage
    retentionLimit: "168h"      # Message retention duration
    diskSpaceLimit: 85          # Max disk usage percentage (0-99)
    persistenceType: "ifoffline" # [nostorage|ifoffline|always]

# Optional: Custom application configuration
user: {}
Custom User Configuration
The user: section in YAML allows you to add custom application-specific configuration alongside Mir configuration.
type AppConfig struct {
    Sensors []SensorConfig `yaml:"sensors"`
    Interval time.Duration `yaml:"interval"`
    ApiKey   string        `yaml:"apiKey" cfg:"secret"`
}

type SensorConfig struct {
    Type     string        `yaml:"type"`
    Unit     string        `yaml:"unit"`
    Interval time.Duration `yaml:"interval"`
    Password string        `yaml:"password" cfg:"secret"`
}
Note: Use the field tag
cfg:"secret"tag to mark sensitive fields. These will be excluded from logs.
mir:
  target: "nats://localhost:4222"
  device:
    id: "weather-station"
user:
  interval: 60s
  apiKey: "secret-key"
  sensors:
    - type: "temperature"
      unit: "C"
      interval: 10s
      password: "sensor-pass"
    - type: "humidity"
      unit: "%"
      interval: 30s
      password: "humid-pass"
Building with Custom Config
var appConfig AppConfig

m, err := mir.Builder().
    DefaultConfigFile().
    BuildWithExtraConfig(&appConfig)
if err != nil {
    panic(err)
}

// Now use your custom config
for _, sensor := range appConfig.Sensors {
    fmt.Printf("Sensor: %s, Unit: %s, Interval: %v\n",
        sensor.Type, sensor.Unit, sensor.Interval)
}
Recommended Setup
Most configuration should be external in the configuration file. Use Default locations to load required files such as configuration, credentials and certificates.
See Security for credentials and certificate.
var appConfig AppConfig

m, err := mir.Builder().
    DefaultConfigFile().
    DefaultUserCredentialsFile().
	DefaultClientCertificateFile().
	DefaultRootCAFile().
	Schema(schemav1.File_schema_v1_schema_proto).
    BuildWithExtraConfig(&appConfig)
if err != nil {
    panic(err)
}

// Now use your custom config
for _, sensor := range appConfig.Sensors {
    fmt.Printf("Sensor: %s, Unit: %s, Interval: %v\n",
        sensor.Type, sensor.Unit, sensor.Interval)
}
Next Steps
Now that you understand device configuration, continue with:
- Device Communication - Learn how devices communicate with Mir
- Security - Learn how to secure your environment
What’s Next
Congratulations! You’ve successfully integrated your device with Mir and learned the fundamentals of telemetry, commands, and configuration. Now you’re ready to explore the full potential of the Mir ecosystem.
Data Management and Visualization
Grafana Integration
Your device telemetry is automatically available in Grafana:
- Navigate to
http://localhost:3000to explore your data - Create custom dashboards for your specific use cases
- Set up alerts based on device metrics
Advanced Data Queries
- Learn InfluxDB query language for complex time-series analysis
- Configure data retention policies
- Export data for external analysis
- Configure alerting based on your telemetry
Device Management at Scale
Fleet Operations
- Mir CLI: Master advanced CLI commands for bulk device operations
Monitoring and Observability
- Set up comprehensive monitoring with Prometheus and Grafana
Integration Patterns
Module SDK
Extend Mir’s server-side capabilities:
- Module SDK Tutorial - Build custom server-side logic
- Event-driven architecture patterns
- Third-party system integrations
Production Deployment
Learning Resources
Documentation Sections
- Concepts - Deep dive into Mir’s architecture
- Operating Mir - CLI, monitoring, and administration
- Running Mir - Deployment and infrastructure
- Resources - Troubleshooting and contributing
Examples and Templates
- Explore the
examples/directory in the Mir repository - Use
mir tools generate device-templatefor new projects
Community and Support
Getting Help
- GitHub Issues - Report bugs and feature requests
- Discussions - Community Q&A
Stay Updated
- Follow the Roadmap for upcoming features
- Check Release Notes for updates
- Join the community for announcements and discussions
Next Steps
- Set up production monitoring with Grafana dashboards
- Explore the Module SDK for server-side extensions
- Implement security best practices for production deployment
- Scale your deployment using Docker or Kubernetes
- Join the community to share your experiences and learn from others
The Mir ecosystem provides everything you need to build, deploy, and manage IoT solutions at scale. Start with what interests you most, and gradually expand your knowledge as your requirements grow.
Module SDK
The Mir Module SDK enables you to build custom applications and services that integrate with the Mir IoT Hub ecosystem on the server side. Whether you’re creating automation workflows, data processors, analytics services, or management tools, the Module SDK provides a complete set of APIs to interact with devices, events, and the Mir platform.
Use the Module SDK to extend the server side capabilities, to integrate with your own ecosystem.
What is a Module?
A module is any application or service that connects to Mir Server Side to extend its functionality. Modules can:
- Monitor devices - Subscribe to device telemetry, heartbeats, status changes and more
- Control devices - Send commands and configurations to devices
- Process events - React to system events like device connections, disconnections, and state changes
- Manage devices - Create, update, delete, and query device metadata
- Build integrations - Connect Mir to external systems and services
- Create automation - Implement workflows and business logic
- Analyze data - Process telemetry streams for analytics and insights
Communication Patterns
Modules communicate using three main patterns:
-
Device Routes (
m.Device()) - Interact directly with device streams- Subscribe to telemetry, heartbeats, schemas, and custom device messages
- Send custom communication with devices
-
Client Routes (
m.Client()) - Interact with Mir services- CRUD operations on devices
- Query telemetry and command history
- Send commands and configurations via Mir services
- Publish custom client messages
-
Event Routes (
m.Event()) - React to system events- Subscribe to device lifecycle events (online, offline, created, updated, deleted)
- Monitor command and configuration events
- Publish custom events
Key Features
- Connection Management with automatic reconnection
- Subscribe to specific device or all devices
- Subscribe to client request
- Create your own custom route
- Implement worker patterns with queue subscriptions
- Full support for authentication and encryption
- JWT and nKeys
- ServerOnly and Mutual TLS
Use Cases
- Device Management: Build custom management tools and dashboards that provide specialized device management capabilities.
- Integrating Services: Connect Mir to external systems like databases, message queues, cloud services, or enterprise applications.
- Automation & Orchestration:: Implement complex workflows that respond to events and coordinate actions across multiple devices.
- Monitoring & Alerting: Build custom monitoring solutions that watch device telemetry and trigger alerts based on custom logic.
- Data Processing: Create data pipelines that process telemetry streams, aggregate data, or forward data to external systems.
- Analytics: Build real-time analytics services that process telemetry data and generate insights.
Getting Started
Ready to build your first module? Continue to the Getting Started guide to create your first Mir module.
Next Steps
- Getting Started - Create your first module
- Routes - Define custom NATS route handlers
- Routes Example - Explore practical examples
Getting Started
This guide will walk you through creating your first Mir Module. You’ll learn how to connect to Mir Ecosystem and interact with the platform.
Prerequisites
- Go 1.21 or later
- Access to Mir Repository
- Access to a running Mir instance
Design
The Module SDK is a wrapper around the NatsIO Client with additional features. Similar to the DeviceSDK, it has functions that binds directly to Mir Routes.
Installation
Add the Mir Module SDK to your Go project:
go get github.com/maxthom/mir/pkgs/module/mir
Packages
Divided into two packages:
// ModuleSDK
"github.com/maxthom/mir/pkgs/module/mir"
// Models
"github.com/maxthom/mir/pkgs/mir_v1"
Basic Module
Let’s create a simple module that monitors device connections and telemetry.
1. Create the Project Structure
mkdir my-first-module
cd my-first-module
go mod init my-first-module
go get github.com/maxthom/mir/pkgs/module/mir
2. Write the Code
Create main.go:
package main

import (
    "fmt"
    "os"
    "os/signal"
    "syscall"

    "github.com/maxthom/mir/pkgs/module/mir"
    "github.com/maxthom/mir/pkgs/mir_v1"
)

func main() {
    // Connect to Mir
    m, err := mir.Connect(
        "my-first-module",
        "nats://localhost:4222",
        mir.WithDefaultReconnectOpts()...,
    )
    if err != nil {
        panic(err)
    }
    defer m.Disconnect()
    fmt.Println("Module started!")

    // Wait for shutdown signal
    sigChan := make(chan os.Signal, 1)
    signal.Notify(sigChan, syscall.SIGINT, syscall.SIGTERM)
    <-sigChan

    fmt.Println("Shutting down...")
}
mir.Connect()function can accept a list of NATS options to configure the connection. See docs. Moreover, the SDK provides some common options.
WithUserCredentials(...)WithRootCA(...)WithClientCertificate(...)WithDefaultReconnectOpts(...)WithDefaultConnectionLogging(...)
3. Run the Module
go run main.go
You should see:
Module started!
Next Steps
Now that you have a basic module running, explore more advanced features:
- Module SDK Overview - Complete API reference
- Routes - Define custom NATS route handlers
- Routes Example - Working examples
Routes
The Module SDK provides three main route types for interacting with the Mir ecosystem. Each route type serves a different purpose and follows consistent patterns.
Route Types Overview
| Route Type | Purpose | Direction | Pattern |
|---|---|---|---|
| Device | Direct device communication | Device ↔ Module | Subscribe to device streams |
| Client | Server-side operations | Module ↔ Mir Services | Request/Response & Subscribe |
| Event | System event notifications | Mir → Module | Subscribe to events & Publish |
Common Patterns
Subscribe vs QueueSubscribe
All routes support two subscription modes:
- Subscribe: Every module instance receives all messages
- QueueSubscribe: Messages are distributed across module instances (worker pattern)
// Standard subscription - all instances receive messages
m.Device().Telemetry().Subscribe("*", handler)

// Queue subscription - only one instance receives each message
m.Device().Telemetry().QueueSubscribe("workers", "*", handler)
Use * to subscribe to all devices or deviceId for a single specific device.
Message Acknowledgment
Always acknowledge messages after processing:
func handler(msg *mir.Msg, deviceId string, data []byte) {
    // Process the message
    processData(data)

    // Acknowledge
    msg.Ack()
}
Routes Layout
All routes in Mir follow a structured subject pattern based on NATS. Understanding this structure helps you create custom routes and understand how messages are routed.
Route Subject Structure
Routes are composed of multiple segments separated by dots (.):
<type>.<id>.<module>.<version>.<function>.<extra...>
Segment Definitions:
-
Type - The route category:
device- Direct device communicationclient- Server-side operations (module-to-module or module-to-service)event- System event notifications
-
ID - The identifier for routing:
- For device routes:
deviceId(or*for all devices) - For client routes:
clientId(or*for all clients) - For event routes:
eventId(or*for all events)
- For device routes:
-
Module - Your module/application name:
- Identifies which module or service the route belongs to
- Example:
"myapp","cfg","core","tlm", etc
-
Version - Schema/API version:
- Semantic versioning:
"v1","v2","v1alpha" - Allows route evolution without breaking existing subscribers
- Semantic versioning:
-
Function - The specific operation or data type:
- What the route does or what type of data it carries
- Example:
"list","send","update"
-
Extra - Optional additional routing tokens:
- Further refine routing as needed
- Example:
"high-priority","zone-a"
Creating Custom Routes
Use the NewSubject() function to create custom routes:
// Device custom route
subject := m.Device().NewSubject("myapp", "v1", "temperature", "celsius")
m.Device().Subscribe(subject, handler)
// Subscribes to: device.*.myapp.v1.temperature.celsius

// Client custom route
subject := m.Client().NewSubject("myapp", "v1", "process-data")
m.Client().Subscribe(subject, handler)
// Subscribes to: client.*.myapp.v1.process-data

// Event custom route
subject := m.Event().NewSubject("*", "myapp", "v1", "alert")
m.Event().SubscribeSubject(subject, handler)
// Subscribes to: event.*.myapp.v1.alert
Wildcards
Use * to subscribe to multiple routes:
// Subscribe to all devices
m.Device().Telemetry().Subscribe("*", handler)
// Matches: device.*.mir.v1.telemetry

// Subscribe to all events from your module
subject := m.Event().NewSubject("*", "myapp", "v1", "*")
m.Event().SubscribeSubject(subject, handler)
// Matches: event.*.myapp.v1.*
Message Metadata
All routes provide access to message metadata through the *mir.Msg type:
func handler(msg *mir.Msg, ...) {
    // Get trigger chain (array of all services that handled this message)
    chain := msg.GetTriggerChain()
    fmt.Printf("Trigger chain: %v\n", chain)

    // Get origin (first service in chain)
    origin := msg.GetOrigin()
    fmt.Printf("Origin: %s\n", origin)

    // Get original trigger ID
    originalTrigger := msg.GetOriginalTriggerId()

    // Get timestamp
    timestamp := msg.GetTime()
    fmt.Printf("Time: %s\n", timestamp)

    // Get protobuf message name (for telemetry, commands, etc.)
    msgName := msg.GetProtoMsgName()
    fmt.Printf("Proto message: %s\n", msgName)

    // Access underlying NATS message
    natsMsg := msg.Msg
    fmt.Printf("Subject: %s\n", natsMsg.Subject)
    fmt.Printf("Reply: %s\n", natsMsg.Reply)
}
Routes Examples
Device Routes
Purpose: Subscribe to real-time data streams directly from devices.
Device routes provide direct access to device communication streams, allowing you to monitor and interact with devices in real-time.
Pattern: Subscribe to Device Streams
All device routes follow this pattern:
- Filter by device ID (use
"*"for all devices or specific device ID) - Receive device data in handler
- Process and acknowledge messages
Example: Heartbeat Route
Heartbeat routes allow you to monitor device connectivity by subscribing to periodic heartbeat messages sent by devices.
package main

import (
    "fmt"
    "time"
    "github.com/maxthom/mir/pkgs/module/mir"
)

func main() {
    m, _ := mir.Connect("heartbeat-monitor", "nats://localhost:4222")
    defer m.Disconnect()

    // Subscribe to heartbeats from all devices
    m.Device().Heartbeat().Subscribe(
        "*", // All devices
        func(msg *mir.Msg, deviceId string) {
        		...
            msg.Ack()
        },
    )

    // Subscribe to heartbeats from a specific device
    m.Device().Heartbeat().Subscribe(
        "critical-sensor-01",
        func(msg *mir.Msg, deviceId string) {
        		...
            msg.Ack()
        },
    )
}
Custom Device Routes
Create custom routes for your own device protocols:
// Subscribe to custom device messages
sbj := m.Device().NewSubject("mymodule", "v1", "custom-data")
m.Device().Subscribe(sbj,
    func(msg *mir.Msg, deviceId string, data []byte) {
        // Handle custom data
        msg.Ack()
    })
Client Routes
Purpose: Interact with Mir services for server-side operations and device management.
Client routes provide request/response interactions with Mir’s core services. They support both:
- Request: Call a service and get a response
- Subscribe: Implement a service that responds to requests
Example: List Devices
List operations demonstrate the simple request pattern for querying data from Mir services.
package main

import (
    "fmt"
    "github.com/maxthom/mir/pkgs/module/mir"
    "github.com/maxthom/mir/pkgs/mir_v1"
)

func main() {
    m, _ := mir.Connect("device-query", "nats://localhost:4222")
    defer m.Disconnect()

    // List all devices in a namespace
    devices, err := m.Client().ListDevice().Request(mir_v1.DeviceTarget{Namespaces: []string{"default"}}, true)
    if err != nil {
        fmt.Printf("Failed to list devices: %v\n", err)
        return
    }

    fmt.Printf("Found %d devices in namespace 'default':\n", len(devices))
}
Custom Client Routes
Create custom routes for module-to-module communication:
// Subscribe to custom requests and reply
sbj := m.Client().NewSubject("mymodule", "v1", "process-data")
m.Client().Subscribe(sbj,
    func(msg *mir.Msg, clientId string, data []byte) {
      // Process request
      result := processData(data)

      // Send response if needed
      if msg.Reply != "" {
				reply := &nats.Msg{
					Subject: msg.Reply,
					Data:    result,
				}
				_ = m.Bus.PublishMsg(reply)
      }
      msg.Ack()
    }
)
Event Routes
Purpose: Subscribe to system events and publish custom events.
Event routes provide a publish/subscribe pattern for system-wide notifications. Events are emitted when important actions occur in the system.
Pattern: Subscribe and Publish
Event routes follow a pub/sub pattern:
- Subscribe: Listen for events (all or filtered by subject)
- Publish: Emit custom events
- Events include trigger chains to track origin
Example: Device Online Events and Custom Publish
Subscribe to device online events and publish custom events.
package main

import (
    "fmt"
    "github.com/maxthom/mir/pkgs/module/mir"
    "github.com/maxthom/mir/pkgs/mir_v1"
)

func main() {
    m, _ := mir.Connect("event-monitor", "nats://localhost:4222")
    defer m.Disconnect()

    // Subscribe to device online events
    m.Event().DeviceOnline().Subscribe(
        func(msg *mir.Msg, deviceId string, device mir_v1.Device, err error) {
            if err != nil {
                fmt.Printf("Error: %v\n", err)
                msg.Ack()
                return
            }

            fmt.Printf("Device came online: %s/%s\n",
                device.Meta.Namespace, device.Meta.Name)

            // Publish a custom event when a device comes online
            publishWelcomeEvent(m, device)

            msg.Ack()
        },
    )

    select {} // Keep running
}

func publishWelcomeEvent(m *mir.Mir, device mir_v1.Device) {
    // Create custom event subject
    eventSubject := m.Event().NewSubject(
        "welcome",      // Event ID
        "mymodule",     // Module name
        "v1",           // Version
        "device-hello", // Event type
    )

    // Create event
    event := mir_v1.EventSpec{
        Type:    mir_v1.EventTypeNormal,
        Reason:  "DeviceWelcome",
        Message: fmt.Sprintf("Welcome device %s", device.Meta.Name),
        RelatedObject: device.Object,
    }

    // Publish the event
    err := m.Event().Publish(eventSubject, event, nil)
    if err != nil {
        fmt.Printf("Failed to publish welcome event: %v\n", err)
    }
}
Running Mir
Choose the deployment method that best fits your environment and needs:
- Local development of Mir by cloning the repository
- To work on the Mir codebase
- Binary from Github releases
- Simple installation
- For device development and testing
- Docker & Docker Compose
- For development and testing
- For simple production
- Kubernetes via Helm Chart
- For real production scenario
Local Development & Testing
Pre-requisites
To run Mir locally, you need to have the following installed:
Once you have the above installed, you can run the following commands to complete installation:
# Linux
./scripts/tooling.sh

# Windows
go install github.com/air-verse/air@latest
go install google.golang.org/protobuf/cmd/protoc-gen-go@latest
go install github.com/bufbuild/buf/cmd/buf@latest
cargo install mdbook@0.4.40
cargo install just
To finish:
git clone git@github.com:MaxThom/mir.git
Running
Mir relies on a number of services to run:
- InfluxDB: A time-series database for storing telemetry data
- SurrealDB: A key-value store for storing device data
- Prometheus: A monitoring and alerting toolkit
- Grafana: A visualization tool for monitoring data
- NatsIO: A message broker for communication between device and services
These services are defined in the docker compose file. To start the services, run the following command:
just infra
# or
docker compose -f infra/compose/local_support/compose.yaml up --force-recreate
# or VsCode/Zed task
Mir infra dev
# Service: Grafana
# URL: http://localhost:3000
# Username: admin / Password: mir-operator

# Service: InfluxDB
# URL: http://localhost:8086
# Username: admin / Password: mir-operator

# Service: SurrealDB
# URL: http://localhost:8000
# Username: root / Password: root

# Service: Prometheus
# URL: http://localhost:9090

# Service: NATS
# URL: http://localhost:8222
Note: Cockpit (web UI) is served by
mir serveonhttp://localhost:3015, not by the infra stack.
To build Mir binary, run the following command:
just build
# or
go build -o bin/mir cmds/mir/main.go
The Mir binary comes with a powerful CLI and TUI. It acts as both the client and the server.
Once started as the server, open another terminal and you can use the CLI to interact with the system.
Use the swarm command to simulate a device connecting to the server to explore the Mir ecosystem.
# Server
mir serve
# TUI
mir
# CLI
mir -h
# to interact with devices
mir device ls
# to visualize the telemetry
mir device telemetry
# to send command to devices
mir device command
# to explore and upload schemas
mir device schema
# to simulate a device connecting to the server
mir swarm
Tip: On Linux, you can run just install to install the binary to your system path.
To integrate your own device to the system, visit the device tutorial.
Development
Mir is built with a module architecture. Each module is a standalone service that can be run independently or combined with the CLI. The modules are:
- Core: handles the management of devices
- Telemetry: handles the telemetry ingestion
- Command: handles the command delivery
- Configuration: handles the configuration of devices
The repository comes with a set of vscode or zed task to run each module independently.
Each module is run through Air for hot reloading.
Run the task Mir local dev to start developing. For Zed, each task must be started individually as many tasks is not yet supported.
A set of tmux layouts can be found in the tmux directory to run the modules if using tmux and tmuxifier.
Visit the Justfile to see the available commands and scripts to help develop locally.
Cockpit
Cockpit is the Mir web interface, built with SvelteKit and located in internal/ui/web/. When developing the frontend, run the Vite dev server alongside mir serve:
# Terminal 1 — backend
mir serve

# Terminal 2 — frontend hot reload
cd internal/ui/web
npm install
npm run dev   # serves on http://localhost:5173
The Vite dev server origin must be allowed by the Cockpit CORS config. In ~/.config/mir/mir.yaml, set:
mir:
  cockpit:
    enabled: true
    allowedOrigins:
      - "http://localhost:5173"
The Cockpit frontend connects to NATS via WebSocket using webTarget from your active context (~/.config/mir/cli.yaml). The default local context points to ws://localhost:9222 — no change needed for local dev.
Type-check the frontend with:
cd internal/ui/web
npm run check
Binary
Mir ecosystem can be run through the Mir binary. Head to Github Releases to download the latest version. You will find a bundle for Linux amd64/arm64 and Windows amd64/arm64. Once downloaded, extract the files to retrieve the binary. Add the binary to your path for easy usage.
You can also install the binary via Go (as it is a private repository, follow the access guide):
go install github.com/maxthom/mir/cmds/mir@latest
Running
Mir is composed of the Mir Server side and supporting infrastructure:
- Mir Server: Manage devices, ingest telemetry, send commands and configuration, etc.
- NatsIO: High-speed message bus.
- SurrealDB: Store device digital twin.
- InfluxDB: Store device telemetry.
- PromStack: Provides dashboards, alerting and monitoring of the ecosystem.
All can be run through the binary for a local setup. Mir binary act as both the client and the server providing an integrated experience.
Supporting Infrastructure
To run the supporting infrastructure, you need docker and docker compose installed.
Mir makes it easy to have a local setup by wrapping basic docker compose commands:
# Start the infra
mir infra up

# Stop the infra
mir infra down

# Display running containers
mir infra ps

# Remove containers
mir infra rm

# Write docker compose to disk
mir infra print
All extra flags get passed to docker compose.
The compose files are managed under env. var $XDG_CACHE_HOME defaulting to $HOME/.cache/mir/infra.
# Cockpit
localhost:3015
# Grafana       <user>///<password>
localhost:3000 # admin///mir-operator
# InfluxDB
localhost:8086 # admin///mir-operator
# SurrealDB
localhost:8000 # root///root
# Prometheus
localhost:9090
# NatsIO
localhost:4222
Having embeded docker compose ensure that each distributed Mir binary can have a easy environment as well as providing a starting point if you want to modify the compose.
Mir Server
Once the supporting infrastructure is up and running, open a new terminal and run:
# Run Mir Server
mir serve

# See all possible options and configuration
mir serve -h
Mir Client
With both infrastructure and server started, open another terminal and you can use the CLI to interact with the system. Use the swarm command to simulate a device connecting to the server to explore Mir ecosystem.
# Server
mir serve
# TUI
mir
# CLI
mir -h
# to interact with devices
mir device ls
# to visualize the telemetry
mir device telemetry
# to send command to devices
mir device command
# to explore and upload schemas
mir device schema
# to simulate a device connecting to the server
mir swarm
Mir Cockpit
Cockpit is the Mir web interface, served by the Mir Server on port 3015. Once mir serve is running, open your browser at:
http://localhost:3015
Cockpit connects to the NATS broker using the active context from your CLI config (~/.config/mir/cli.yaml). By default it uses the webTarget WebSocket URL configured in that context:
contexts:
  - name: local
    target: nats://localhost:4222
    webTarget: ws://localhost:9222
    grafana: localhost:3000
To configure or switch contexts, run mir tools config edit.
Visit DeviceSDK documentation to integrate device.
Visit Mir CLI documentation for more information.
Docker & Docker Compose Deployment
Deploy Mir using Docker for containerized environments with flexible configuration options.
Prerequisites
- Docker Engine 20.10+ or Docker Desktop
- Docker Compose v2.0+ (for multi-service deployments)
- Access to Mir GitHub Repository
- Access to Mir GitHub Container Registry (ghcr.io)
Docker Compose Deployment
The Compose comes with a full production setup:
- Mir: IoT Hub core service
- NATS: Message broker for inter-service communication
- InfluxDB: Time-series database for telemetry data
- SurrealDB: General database for device metadata
- Prometheus Stack: Monitoring and observability
- Prometheus
- Grafana
- Loki
- Promtail
- Alertmanager
Quick Start
The easiest way to get started is to download the pre-configured Docker Compose files from the latest Mir release:
# Extract
tar -vxf mir-compose.tar.gz

# Start the complete Mir stack
cd mir-compose/local-mir-support/
docker compose up -d

# Access the server using the CLI on localhost
mir tools config edit
# contexts:
#  - name: local
#    target: nats://localhost:4222
#    webTarget: ws://localhost:9222
#    grafana: localhost:3000
mir ctx local

# Use
mir dev ls

## Stopping
docker compose down

## To stop and remove all data
docker compose down -v

# View logs
docker compose logs mir -f
Configuration
The .env file in local_mir_support/ contains the Mir version.
You can modify other settings in the individual compose files as needed.
ls -lato see hidden files
Environment Variables
Configure Mir using environment variables with the MIR__ prefix. Nested config keys use __ as separator (e.g. mir.http.port → MIR__MIR__HTTP__PORT):
| Variable | Description | Default |
|---|---|---|
MIR__MIR__LOGLEVEL | Logging level | info |
MIR__MIR__HTTP__PORT | Cockpit HTTP port | 3015 |
MIR__MIR__HTTP__TLSCERT | Path to Cockpit TLS certificate | `` |
MIR__MIR__HTTP__TLSKEY | Path to Cockpit TLS private key | `` |
MIR__MIR__COCKPIT__ENABLED | Enable Cockpit service | true |
MIR__MIR__CORE__ENABLED | Enable Core service | true |
MIR__NATS__URL | NATS server URL | nats://localhost:4222 |
MIR__NATS__CREDENTIALS | Path to NATS credentials file | `` |
MIR__NATS__ROOTCA | Path to NATS root CA certificate | `` |
MIR__NATS__TLSCERT | Path to NATS client certificate | `` |
MIR__NATS__TLSKEY | Path to NATS client private key | `` |
MIR__SURREAL__URL | SurrealDB WebSocket URL | ws://localhost:8000 |
MIR__SURREAL__USER | SurrealDB username | root |
MIR__SURREAL__PASSWORD | SurrealDB password | root |
MIR__SURREAL__NAMESPACE | SurrealDB namespace | global |
MIR__SURREAL__DATABASE | SurrealDB database | mir |
MIR__INFLUX__URL | InfluxDB HTTP URL | http://localhost:8086 |
MIR__INFLUX__TOKEN | InfluxDB auth token | `` |
MIR__INFLUX__ORG | InfluxDB organization | Mir |
MIR__INFLUX__BUCKET | InfluxDB bucket | mir |
Configuration File
Mount a configuration file for advanced settings
Modify mir-compose/mir/local-config.yaml
mir:
  logLevel: "info"
  http:
    port: 3015
    tlsCert: "/etc/mir/certs/tls.crt"
    tlsKey: "/etc/mir/certs/tls.key"
  core:
    enabled: true
    deviceOnlineFlush: 7s
    deviceOfflineFlush: 12s
    deviceOfflineAfter: 30s
  prototlm:
    enabled: true
  protocmd:
    enabled: true
  protocfg:
    enabled: true
  event:
    enabled: true
    flushInterval: 5s
  cockpit:
    enabled: true
    allowedOrigins: []
    githubOwner: MaxThom
    githubRepo: mir
nats:
  url: "nats://local_mir_support-nats-1:4222"
  credentials: ""
  rootCA: ""
  tlsCert: ""
  tlsKey: ""
surreal:
  url: "ws://local_mir_support-surrealdb-1:8000/rpc"
  namespace: "global"
  database: "mir"
  user: "root"
  password: "root"
influx:
  url: "http://local_mir_support-influxdb-1:8086/"
  token: "mir-operator-token"
  org: "Mir"
  bucket: "mir"
  batchSize: 1000
  flushInterval: 1000
  retryBufferLimit: 1073741824
  gzip: false
Configure Cockpit Server List
Cockpit reads available contexts from ./mir-compose/mir/local-contexts.yaml (mounted into the container as cli.yaml) and exposes them to the browser via GET /api/v1/contexts. Each context entry defines a server the web UI can connect to.
Edit ./mir-compose/mir/local-contexts.yaml to list your servers:
logLevel: info
currentContext: local
contexts:
  - name: local
    target: nats://localhost:4222
    webTarget: ws://localhost:9222
    grafana: localhost:3000
Restart to apply: docker compose down && docker compose up.
Operating
Port Exposures
# Cockpit
localhost:3015
# Grafana       <user>///<password>
localhost:3000 # admin///mir-operator
# InfluxDB
localhost:8086 # admin///mir-operator
# SurrealDB
localhost:8000 # root///root
# Prometheus
localhost:9090
# NatsIO
localhost:4222 # TCP
localhost:9222 # WebSocket
View Logs
# in mir-compose/local-mir-support/
# View Mir logs
docker compose logs mir

# Follow logs in real-time
docker compose logs -f mir
Multi-Architecture Support
Mir Docker images support multiple architectures:
linux/amd64: Intel/AMD 64-bitlinux/arm64: ARM 64-bitlinux/arm32: ARM 32-bit
Docker automatically selects the appropriate architecture.
Security
Securing the environment is done via the NSC tool. Refer to Docker Authentication for details.
Next Steps
- Configure devices to connect to your Mir instance
- Set up monitoring dashboards in Grafana
- Review Kubernetes deployment for production scale
- Explore the Mir CLI for management
Kubernetes Deployment
Deploy Mir on Kubernetes using Helm charts for production-ready, scalable IoT infrastructure.
Refer to the repository values.yaml for all configuration options.
Prerequisites
- Kubernetes cluster 1.24+
- kubectl configured to access your cluster
- Helm 3.8+
- (Optional) Ingress controller for external access
- (Optional) StorageClass for persistent volumes
- Access to Mir GitHub Repository
- Access to Mir GitHub Container Registry (ghcr.io)
Quick Start
# Add Mir Helm repository
helm repo add mir https://charts.mirhub.io
helm repo update
Create Image Pull Secret
Access to Mir GitHub Container Registry (ghcr.io)
Install Mir Chart
Create a custom.values.yaml with your environment-specific overrides:
imagePullSecrets:
  - name: ghcr-mir-secret

# Configure contexts — tells the Cockpit UI how to reach NATS and Grafana
# Need at one context for this Mir Server
config:
  contexts:
    - name: "production"
      target: "nats://<cluster-ip>:31422"      # NATS TCP for CLI/devices
      webTarget: "ws://<nats-host>/nats-ws"    # NATS WebSocket for Cockpit
      grafana: "http://<grafana-host>"
      sec:
        credentials: ""   # NATS creds file content (leave empty for open)
        rootCA: ""
        tlsCert: ""
        tlsKey: ""
        password: ""      # Cockpit UI password (leave empty to disable)

ingress:
  enabled: true
  className: ""           # nginx, traefik, etc.
  annotations: {}
  hosts:
    - host: mir.example.com
      paths:
        - path: /
          pathType: Prefix

nats:
  enabled: true
  ingress:
    enabled: true
    className: ""
    annotations: {}
    host: nats.example.com   # NATS monitor endpoint
    path: /
    pathType: Prefix
  config:
    websocket:
      ingress:
        enabled: true
        hosts:
          - mir.example.com   # same host as Cockpit
        path: /nats-ws
        pathType: Prefix
        className: ""         # nginx, traefik, etc.
  service:
    merge:
      spec:
        type: LoadBalancer
        ports:
          - appProtocol: tcp
            name: nats
            nodePort: 31422
            port: 4222
            protocol: TCP
            targetPort: nats
          # NodePort for WebSocket, use this or nats.config.websocket.ingress or both
          - appProtocol: tcp
            name: websocket
            nodePort: 31922
            port: 9222
            protocol: TCP
            targetPort: websocket
  config:
    jetstream:
      fileStore:
        pvc:
          size: 10Gi
  container: {}
  #   env:
  #     # Different from k8s units, suffix must be B, KiB, MiB, GiB, or TiB
  #     # Should be ~80% of memory limit
  #     GOMEMLIMIT: 6GiB
  #   merge:
  #     # Recommended minimum: at least 2 CPU cores and 8Gi memory for production JetStream clusters
  #     # Set same limit as request to ensure Guaranteed QoS
  #     resources: {}

surrealdb:
  enabled: true
  ingress:
    enabled: true
    className: ""
    annotations: {}
    hosts:
      - host: surreal.local
        paths:
          - path: /
            pathType: Prefix
    tls: []
  persistence:
    size: 10Gi
  resources: {}

influxdb2:
  enabled: true
  ingress:
    enabled: true
    className: ""
    annotations: {}
    hostname: influx.local
    path: /
    tls: false
  persistence:
    size: 10Gi
  resources: {}
Install Chart
helm install mir mir/mir \
  --namespace mir \
  --create-namespace \
  -f custom.values.yaml
Access Mir
# CLI access via NATS TCP
mir tools config edit
# Set target: nats://<cluster-ip>:31422
mir ctx production
mir dev ls

# Cockpit (web UI) — open in browser
# http://mir.example.com
Deployment Scenarios
The chart includes several pre-configured values files for common deployment scenarios.
1. Minimal Deployment (values-minimal.yaml)
Deploy only Mir services, connecting to external infrastructure.
Use when: You have existing NATS, SurrealDB, and InfluxDB instances.
helm install mir ./mir -f values-minimal.yaml
Configuration required:
- Update external service URLs in the
configsection - Configure authentication credentials
- Adjust resource limits as needed
2. Standard Deployment (values-standard.yaml) (Recommended)
Deploy Mir with all infrastructure components but without a monitoring stack.
Use when: You need a production-ready IoT platform and manage observability separately.
helm install mir ./mir -f values-standard.yaml
Includes:
- Mir services + Cockpit UI
- NATS with JetStream (3-node cluster)
- SurrealDB with 20Gi storage
- InfluxDB with 50Gi storage
3. Full Deployment (values-full.yaml)
Complete deployment with all services and full observability stack.
Use when: You need a self-contained platform with built-in monitoring and logging.
helm install mir ./mir -f values-full.yaml
Includes:
- Everything from Standard deployment
- Prometheus for metrics collection
- Grafana with pre-configured dashboards
- AlertManager for alerting
- Loki for log aggregation
- Promtail for log collection
Note: When
kube-prometheus-stackis disabled, you must also disable the monitoring CRD resources to avoidServiceMonitor/PodMonitorerrors:mirServiceMonitors: enabled: false mirPrometheusRules: enabled: false nats: promExporter: podMonitor: enabled: false
NATS WebSocket
The Cockpit UI connects to NATS via WebSocket. Two exposure options are available:
Via NodePort (simpler)
Directly accessible on port 31922. Set webTarget: "ws://localhost:31922" in your context config.
Via Ingress (recommended for shared/production)
Route WebSocket through the ingress controller on the same host as the Cockpit UI using the NATS chart’s native WebSocket ingress:
nats:
  config:
    websocket:
      ingress:
        enabled: true
        hosts:
          - mir.example.com   # same host as Cockpit
        path: /nats-ws
        pathType: Prefix
        className: traefik    # or nginx, etc.
Set webTarget: "ws://mir.example.com/nats-ws" in your context config.
Traefik handles WebSocket upgrades natively — no additional annotations required.
For HTTPS/WSS deployments, also set
tlsSecretNamein theingressblock. See TLS configuration for the full setup.
Security Considerations
Using Secrets
For production deployments, use Kubernetes secrets for sensitive data:
-
Create secret files from the templates in
secret/directory:mir.secret.yaml— Mir service credentialssurreal.secret.yaml— SurrealDB credentialsinflux.secret.yaml— InfluxDB credentials
-
Apply secrets before installing:
kubectl apply -f secret/
- Reference secrets in your
custom.values.yaml:
## Mir
secretRef: mir-secret

## SurrealDB
surrealdb:
  podExtraEnv:
    - name: SURREAL_USER
      valueFrom:
        secretKeyRef:
          name: surreal-secret
          key: SURREAL_USER
    - name: SURREAL_PASS
      valueFrom:
        secretKeyRef:
          name: surreal-secret
          key: SURREAL_PASS

## InfluxDB
influxdb2:
  adminUser:
    existingSecret: influx-secret
Authentication and Authorization
Securing NATS with TLS and credentials is done via the NSC tool. Refer to Security Tutorial for setup details.
Next Steps
- Set up device connections to your Mir cluster
- Configure monitoring dashboards
- Explore the Mir CLI for cluster management
Operating Mir
Mir provides a comprehensive suite of tools to manage and operate your Mir infrastructure, each designed for specific use cases and user preferences:
Mir CLI
Power user tool for development, automation and system operations. Ideal for scripting and detailed control.
Mir Cockpit
User-friendly web interface for day-to-day device and system management.
Monitoring with Grafana
Rich visualization platform for telemetry data, system monitoring, and custom dashboards.
Choose the tool that matches your needs - from low-level CLI control to high-level web management. 🛠️
Mir CLI
The CLI is both a CLI and a TUI. The CLI offers all interaction with the system and devices.
To get the Mir CLI, visit Running Mir with Binary
To launch in TUI mode, simply run mir without arguments.
The CLI is a powerful low-level tool to interact with the Mir ecosystem. Use it to manage devices, explore telemetry, send commands, serve the ecosystem, and more. Use it as your companion to develop and operate your IoT devices. Use shell scripts to create powerful automation and integration with other tools.
CLI
Let’s start with a tour of the CLI mir -h. The Mir CLI acts as both the client and the server,
giving a unified tool to do all that is required. Moreover, it provides a set of tools
to enhance development and operation.
Usage: mir <command> [flags]

A command line and terminal user interface to operate the Mir ecosystem 🛰️

Commands:
  device (dev)     Manage fleet of Mir devices
  event (evt)      Explore list of events generated by Mir
  swarm            Create virtual devices to mimic workload for test or demo purposes
  serve            Serve Mir ecosystem of servers and services
  infra            Start and stop Mir supporting infrastructure
  context (ctx)    Set and list contexts
  tools            Various tools to interact with Mir ecosystem

Run "mir <command> --help" for more information on a command.
Let’s get the server up and running to have something to work with.
Server
Mir requires it’s supporting infrastructure and it’s services to be running.
Mir infra managed a set of docker compose files for you to have a local environment ready to go at your disposal.
Each extra flag is passed to docker compose. For example, mir infra up -d will run the docker compose in detached mode.
Usage: mir infra <command> [flags]

Start and stop Mir supporting infrastructure

Commands:
  infra up       Run infra docker compose up
  infra down     Run infra docker compose down
  infra ps       Run infra docker compose ps
  infra rm       Run infra docker compose rm
  infra write    Write to disk Mir set of docker compose
Open a terminal and run mir infra up to get the supporting infrastructure running.
With the supporting infrastructure running, we can now start the Mir server. In a new terminal, run mir serve.
The default configuration is made to work in par with the supporting infrastructure setup previously. You can also use mir infra up --include-mir to start infrastructure and Mir together.
If we want to bring an external infrastructure to Mir Server, flags can be passed to modify connections or by using a configuration file.
To help with the configuration, run mir serve --display-default-cfg. This will print the default configuration in yaml.
By default, Mir loads its configuration from /etc/mir/mir.yaml or /home/<USER>/.config/mir/mir.yaml
Tip: Use mir serve --display-default-cfg > /etc/mir/mir.yaml and then edit this file to adjust your configuration needs.
With both infra and serve commands, you have a full Mir setup running!
Mir Context
Mir CLI support multiple Mir Server to connect to. Using mir ctx, you should see the list of configured server.
mir ctx
NAME                 TARGET                         GRAFANA                        CREDENTIALS
*local               nats://localhost:4222          localhost:3000
Use mir ctx <name> to point to another server.
To add server to the list, add the server to the configuration: mir tools cfg edit
Client
Time to interact the system. For that we will use the swarm command to mimic devices.
Start a swarm with mir swarm --ids=power,weather. Open the a new terminal to start interacting with them.
Device Management
With the device command, you can manage your fleet:
# See list of devices
mir device list <name/namespace>
# Print digital twin of a device
mir device list power/default -o yaml
Tip: All commands that interact with devices can be filtered by name/namespace as first positional arguments or with the –target flag.
Use /namespace for all devices in that namespace.
To create a device, you can use the different flags to pass the initial configuration:
mir device create <flags>
You can also use a declarative approach to create a device:
# Output device template to file
mir device create -j > device.yaml
# Edit and create
cat device.yaml | mir device create
There is a few ways to update a device:
# Edit a device interactively
mir device edit power/default
# Edit or create a device declaratively
mir device apply -f <file>.yaml
# You can combine list and apply
mir device list power/default -o yaml > power.yaml
# Edit the file and apply
mir device apply -f power.yaml
# Use set of flags to update a device
mir device update <flags>
Finally, to delete devices:
mir device delete power/default
Device telemetry
mir dev tlm list <name/namespace>
This command will output the list of outgoing telemetry from devices. It will also print a url that you can open to see your data in Grafana.
Tip: If you don’t see all telemetry, use -r to refresh the schema.
The explore panel in Grafana is a great way to see telemetry as well as offering an example of the query to see that data. Use the query as a starting point to build powerful dashboards.
Device command
As device update, there is a few ways to send a command:
# List available commands
mir dev command <name/namespace>
# Shortcut to see available commands
mir dev cmd send <name/namespace>
# See a command json payload
mir dev cmd send <name/namespace> -n <command_name> -j
# Send a command. Single quotes help in writing json on terminal.
mir dev cmd send <name/namespace> -n <command_name> -p '<json_payload>'
# Send a command declaratively
cat payload.json | mir dev cmd send <name/namespace> -n <command_name>
# Send a command interactively
mir dev cmd send <name/namespace> -n <command_name> -e
Each command will return a response from each devices that the command targeted.
Moreover, you can use the flag --dry-runto validate the command without sending it.
Tip: If you don’t see all commands, use -r to refresh the schema.
Device configuration
As device update, there is a few ways to send configuration:
# List available config
mir dev config <name/namespace>
# Shortcut to see available config
mir dev cfg send <name/namespace>
# See a config current values
mir dev cfg send <name/namespace> -n <config_name> -c
# See a config json payload
mir dev cfg send <name/namespace> -n <config_name> -j
# Send a config update. Single quotes help in writing json on terminal.
mir dev cfg send <name/namespace> -n <config_name> -p '<json_payload>'
# Send a config declaratively
cat payload.json | mir dev cfg send <name/namespace> -n <command_name>
# Send a config interactively
mir dev cfg send <name/namespace> -n <config_name> -e
As configuration is async, the server response does not validate if the device received the config,
but indicate if it was successfully sent and written to store.
Moreover, you can use the flag --dry-runto validate the config without sending it.
Tip: If you don’t see all commands, use -r to refresh the schema.
Tools
The Mir CLI provices a set of tools to enhance development:
# Install required tools for Device development
mir tools install
# Generate Mir device schema
mir tools generate mir-schema
# Generate a device project template to get started
mir tools generate device-template <module-name>
# Manage device credentials and authorization
mir tools security
# See CLI logs
mir tools log
# View and configure the CLI
mir tools cfg
TUI
The TUI or Terminal User Interface is a way to interact with the system in a more visual and interactive way.
Simple run mir to get it running!
Use ? to get help on the current view and see the equivalent CLI command. Yours to explore.
Mir Swarm
Mir Swarm is a powerful device simulator that enables you to create and manage virtual IoT device fleets for testing, development, and demonstrations. It can simulate hundreds or thousands of devices with realistic sensor patterns, all defined through simple YAML configuration files.
Overview
The Swarm feature provides a flexible way to:
- Performance Test your Mir deployment under realistic device loads
- Load Test the system with concurrent devices sending telemetry
- Develop Features using test data without physical hardware
- Demo Capabilities with realistic IoT scenarios
- CI/CD Testing with reproducible device swarms
Quick Start
Simple Device Swarm
The quickest way to start a swarm is with device IDs:
# Start a swarm with specific device IDs
mir swarm --ids=reco,capstone,pathstone
This creates simple devices that send basic telemetry data.
Advanced Swarm with Configuration
For more complex scenarios, use a YAML configuration file:
# Generate a template configuration
mir swarm -j > my-swarm.yaml

# Edit the file to customize your swarm
# Launch the swarm from file
mir swarm -f my-swarm.yaml

# Or pipe the configuration
cat my-swarm.yaml | mir swarm

# Or run the example swarm
mir swarm -j | mir swarm
Configuration Structure
apiVersion: mir/v1alpha
kind: swarm
meta:
  name: "local"           # Schema package name component
  namespace: "swarm"      # Schema package namespace
  labels: {}
  annotations: {}
swarm:
  logLevel: info          # debug|info|warn|error
  deployBatchSize: 10     # Number of deploy batches to distribute deploy
  devices: []             # Device group definitions
  fields: []              # Field definitions (shared across devices)
Device Groups
Define groups of devices with shared characteristics:
devices:
  - count: 100                    # Number of devices to create
    meta:
      name: "sensor"              # Device name prefix (sensor__0, sensor__1, ...)
      namespace: "swarm"        # Namespace for devices
      annotations:
        swarm: "true"             # Custom annotations
        environment: "test"
      labels:
        type: "environmental"     # Custom labels
    telemetry: []                 # Telemetry message definitions
    commands: []                  # Command message definitions
    properties: []                # Configuration properties definitions
Note: If count: 1, the device name is used as-is. For count > 1, devices are named {name}__{index} (e.g., sensor__0, sensor__1).
Telemetry Configuration
Define telemetry messages that devices will send periodically:
telemetry:
  - name: Environment           # Proto message name
    interval: 5s                # Send interval (e.g., 1s, 30s, 1m)
    tags:                       # Message-level tags
      unit_system: "metric"
    fields:                     # List of field names (defined in fields section)
      - temperature
      - humidity
      - pressure
Commands Configuration
Define commands that devices can handle:
commands:
  - name: ActivateHVAC          # Proto message name
    delay: 2s                   # Response delay simulation
    tags:
      category: "control"
    fields:                     # Command parameters
      - power
      - duration
Commands automatically echo back the received data after the specified delay, simulating device processing time.
Properties Configuration
Define configuration properties (desired/reported state):
properties:
  - name: SensorConfig          # Proto message name
    delay: 1s                   # Time to apply configuration
    tags:
      type: "settings"
    fields:                     # Configuration fields
      - sampleRate
      - enabled
When desired properties are sent to a device, the swarm will update the reported properties with the same values after the specified delay.
Field Definitions
Fields are the building blocks for telemetry, commands, and properties. They can be value types or nested message types.
fields:
  - name: temperature
    type: float64               # int8|int16|int32|int64|float32|float64|message
    tags:
      unit: "C"
      sensor: "DHT22"
    generator:                  # For telemetry data generation
      expr: "20 + 5*sin(t)"     # Mathematical expression
Create nested message structures by composing other fields:
fields:
  - name: environmentalData
    type: message               # Composite type
    tags:
      category: "sensors"
    fields:                     # References to other field definitions
      - temperature
      - humidity
      - pressure
  - name: consumption
    type: message
    fields:
      - power
      - energy
Generator Expressions
For telemetry field only, expressions use t as the time variable and support mathematical functions:
generator:
  expr: "10*sin(t) + 3"
Supported Functions
| Function | Description | Example |
|---|---|---|
sin(x) | Sine | 10*sin(t) |
cos(x) | Cosine | 5*cos(t) |
tan(x) | Tangent | tan(t/10) |
abs(x) | Absolute value | abs(sin(t)) |
sqrt(x) | Square root | sqrt(abs(t)) |
pow(x,y) | Power | pow(t, 2) |
exp(x) | Exponential | exp(t/100) |
log(x) | Natural log | log(t+1) |
log10(x) | Base-10 log | log10(t+1) |
floor(x) | Floor | floor(sin(t)*10) |
ceil(x) | Ceiling | ceil(cos(t)*10) |
round(x) | Round | round(tan(t)) |
min(x,y) | Minimum | min(sin(t), 0.5) |
max(x,y) | Maximum | max(cos(t), -0.5) |
rand | Random | rand(0, 100) |
Constants
| Constant | Value | Description |
|---|---|---|
pi or π | 3.14159… | Pi constant |
e | 2.71828… | Euler’s number |
t | time.Now() | Current time |
Example Patterns
# Oscillating temperature (15-25°C)
generator:
  expr: "20 + 5*sin(t/60)"

# Random noise around baseline
generator:
  expr: "100 + rand*20 - 10"

# Exponential growth with cap
generator:
  expr: "min(100, exp(t/1000))"

# Square wave pattern
generator:
  expr: "floor(sin(t)) * 100"

# Dampened oscillation
generator:
  expr: "exp(-t/1000) * sin(t)"

# Combined patterns
generator:
  expr: "50 + 20*sin(t/30) + 5*cos(t/10) + rand*2"
Complete Example
Here’s a comprehensive example demonstrating all features:
apiVersion: mir/v1alpha
kind: swarm
meta:
  name: "perftest"
  namespace: "testing"
  labels:
    environment: "staging"
  annotations:
    created-by: "mir-swarm"
swarm:
  logLevel: info
  deployBatchSize: 10
  devices:
    # Environmental sensor fleet
    - count: 1
      meta:
        name: env-sensor
        namespace: default
        annotations:
          location: "warehouse"
        labels:
          type: "environmental"
      telemetry:
        - name: Environment
          interval: 10s
          tags:
            unit_system: "metric"
          fields:
            - temperature
            - humidity
            - pressure
        - name: AirQuality
          interval: 30s
          fields:
            - co2
            - voc
      commands:
        - name: Calibrate
          delay: 3s
          fields:
            - calibrationMode
      properties:
        - name: SensorConfig
          delay: 1s
          fields:
            - sampleRate
            - enabled
    # Power monitoring fleet
    - count: 1
      meta:
        name: power-monitor
        namespace: default
        labels:
          type: "power"
      telemetry:
        - name: PowerMetrics
          interval: 5s
          tags:
            unit_system: "metric"
          fields:
            - consumption
      commands:
        - name: ResetMetrics
          delay: 1s
          fields:
            - resetType

  # Field definitions
  fields:
    # Environmental sensors
    - name: temperature
      type: float64
      tags:
        unit: "C"
      generator:
        expr: "22 + 3*sin(t/120)"
    - name: humidity
      type: float64
      tags:
        unit: "%"
      generator:
        expr: "60 + 15*cos(t/180) + 2"
    - name: pressure
      type: float64
      tags:
        unit: "Pa"
      generator:
        expr: "101325 + 100*sin(t/300)"
    - name: co2
      type: float64
      tags:
        unit: "ppm"
      generator:
        expr: "400 + 50*sin(t/600)"
    - name: voc
      type: float64
      tags:
        unit: "ppb"
      generator:
        expr: "100 + 30*cos(t/450)"
    # Power monitoring
    - name: consumption
      type: message
      fields:
        - power
        - energy
    - name: power
      type: float64
      tags:
        unit: "W"
      generator:
        expr: "100 + 30*cos(t/450)"
    - name: energy
      type: float64
      tags:
        unit: "kWh"
      generator:
        expr: "t/3600"
    # Command/config fields
    - name: calibrationMode
      type: int32
      tags:
        description: "Calibration mode: 0=auto, 1=manual"
    - name: sampleRate
      type: int32
      tags:
        unit: "Hz"
    - name: enabled
      type: bool
    - name: resetType
      type: string
mir swarm -f performance-test.yaml
Mir Swarm helps with testing and development by providing a declarative, scalable way to simulate device fleets. Whether you need to validate system performance with thousands of concurrent devices, develop new features without physical hardware, or create compelling demonstrations, Swarm delivers the flexibility and realism required.
Cockpit
Cockpit is Mir’s web interface — a browser-based view of the platform with no separate deployment required.
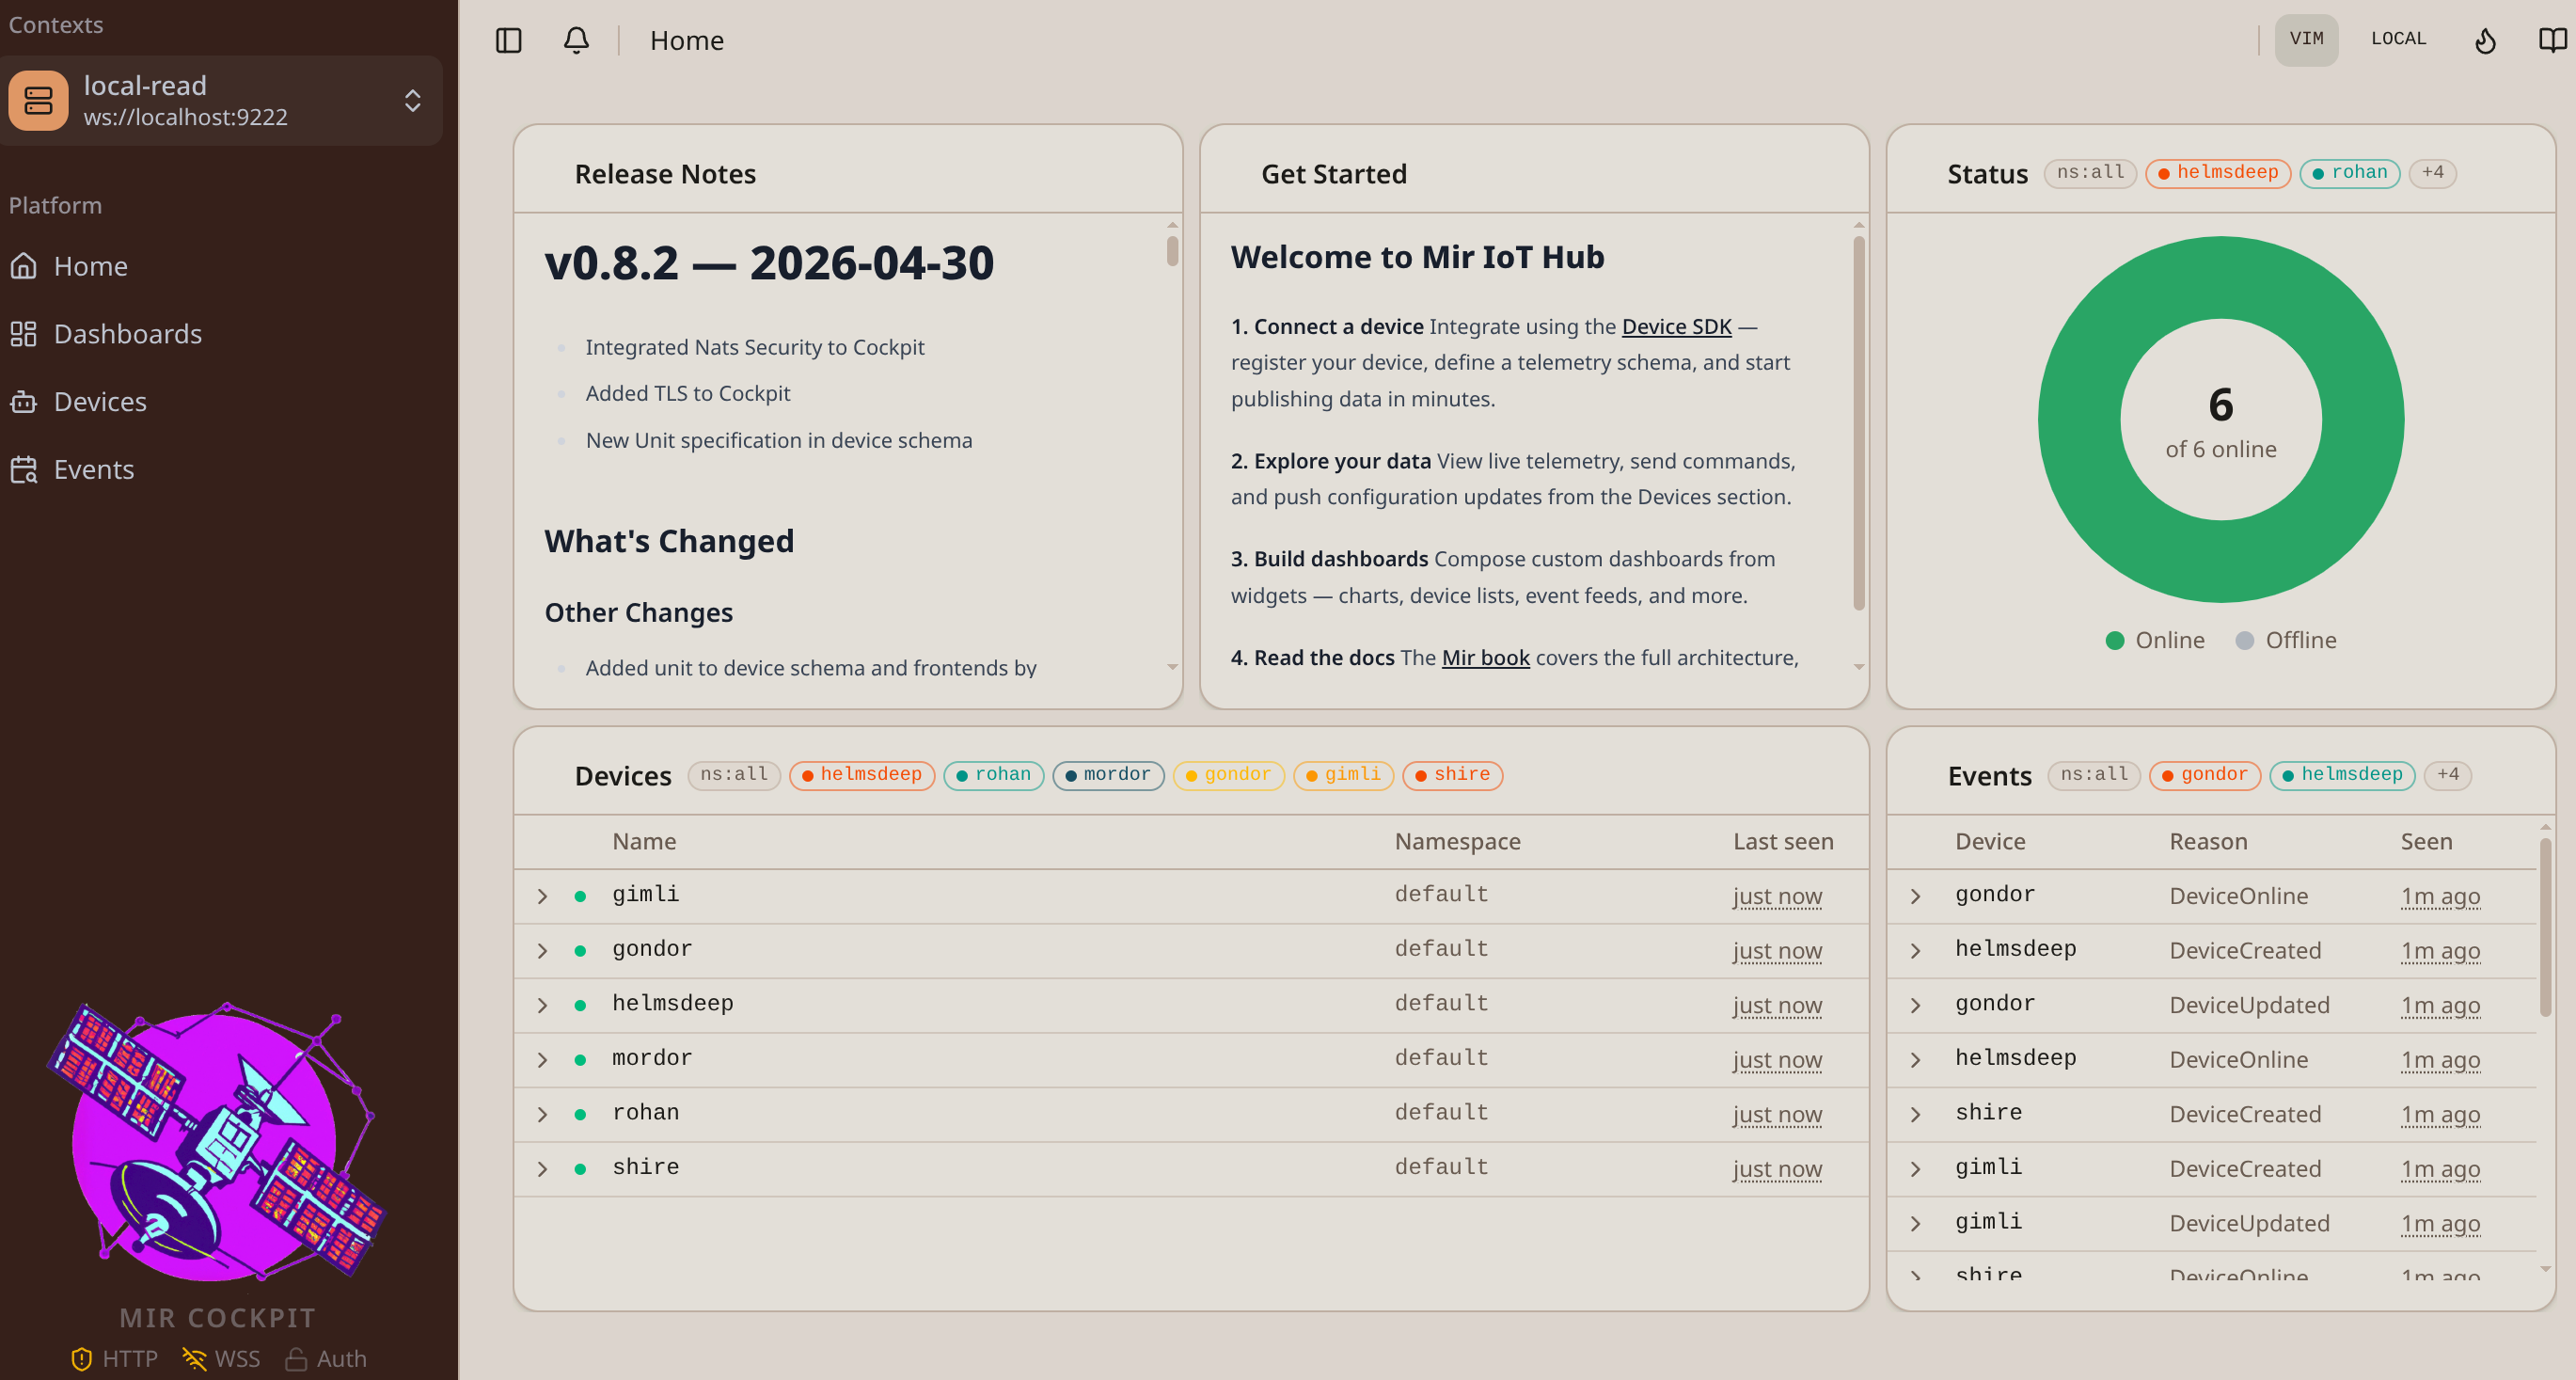
Dashboards
Fully customizable widget grid — drag, resize, and arrange tiles freely. The home page shows a pre-configured welcome dashboard; more can be created from the Dashboards section.
| Layout | Drag-and-drop widgets, read-only / edit mode toggle |
| Refresh | Auto-refresh with configurable interval |
| Persistence | Layouts saved across sessions |
Device Fleet
Live table of all registered devices. Click any device to open its detail view across five tabs:
| Tab | Description |
|---|---|
| Overview | Digital twin — namespace, ID, labels, desired vs. reported properties |
| Telemetry | Interactive charts with field selector, time presets (1 min → 90 days), brush zoom, split views, data table, and Grafana link |
| Commands | Send commands with a syntax-highlighted JSON editor, dry-run validation, and a per-status response panel (SUCCESS ERROR VALIDATED PENDING) |
| Configuration | Edit config schemas, compare reported vs. desired values, dry-run before applying |
| Events | Device-scoped log of all interactions and state changes |
Events
System-wide log of all platform activity — connections, commands, config changes, schema uploads. Supports pagination (up to 500 per page), time-range filtering, and UTC / local time toggle.
Interface
| Context Switcher | Switch between Mir deployments from the header — one Cockpit can reach multiple servers |
| Themes | 7 built-in themes: Dawn, Rust, Mocha, Dusk, Aurora, Midnight, Hacker |
| VIM Mode | VIM keybindings for JSON payload editors — pass a small proficiency test to unlock (hint: :q) |
| Time Display | Toggle UTC / local time for all timestamps via the clock icon |
| Docs Drawer | In-app documentation covering Cockpit, CLI, and SDK development |
🚀 Operating Cockpit
Accessing Cockpit
Have a Mir deployment ready:
Once mir is running, open your browser at the configured port:
http://localhost:3015
Cockpit is a single-page application built with Svelte.
🔌 How It Connects
Cockpit does not connect to NATS directly over TCP — it uses a WebSocket connection defined by webTarget in your CLI contexts config (~/.config/mir/cli.yaml). This allows the browser to reach the NATS message bus through a standard WebSocket port.
contexts:
  - name: local
    target: nats://localhost:4222      # used by the CLI
    webTarget: ws://localhost:9222     # used by Cockpit (browser)
    grafana: localhost:3000
| Key | Description |
|---|---|
target | NATS TCP URL — used by the CLI and the Mir server itself |
webTarget | WebSocket URL — used by the Cockpit browser client |
grafana | Grafana base URL — powers “Open in Grafana” links on the telemetry page |
If
webTargetis not set, Cockpit falls back totargeton port9222.
Port
9222is the NATS WebSocket listener — it is configured on the NATS server side, not by Cockpit itself.
⚙️ Configuration
Cockpit is configured in two files.
Server Config
Controls the HTTP server and Cockpit service behaviour:
mir:
  http:
    port: 3015          # port Cockpit is served on
    tlsCert: ""         # path to TLS certificate (enables HTTPS)
    tlsKey: ""          # path to TLS private key
  cockpit:
    enabled: true
    allowedOrigins: []  # CORS allowed origins (empty = allow all)
    githubOwner: MaxThom
    githubRepo: mir
Contexts Config
Defines the servers Cockpit exposes to the browser:
logLevel: info
currentContext: local
contexts:
  - name: local
    target: nats://localhost:4222
    webTarget: ws://localhost:9222
    grafana: localhost:3000
In Docker, these map to the two mounted config files:
./mir-compose/mir/local-config.yaml→ server config./mir-compose/mir/local-contexts.yaml→ contexts config
See Docker Authentication for the full setup flow with authentication.
See Server-Only TLS for HTTPS and WSS setup.
Monitoring
To operate Mir effectively, it’s essential to have a robust monitoring system in place. Grafana plays a crucial role in this process by providing a comprehensive monitoring solution for the Mir platform. It is used to display devices data as well as monitoring the health of the system.
What is Grafana?
Grafana is an open-source analytics and interactive visualization web application. It’s primarily used for data visualization, monitoring, and alerting. It provides a flexible and powerful platform for creating dashboards and visualizing metrics over time. It offers a wide range of features and integrations to help users monitor and analyze their data effectively.
The provided Grafana is configured to work with Mir’s Prometheus server, SurrealDB, and InfluxDB.
Display devices data
As explained in the CLI documentation, you can use the mir dev tlm list command to display devices data. The explore panel in Grafana is a great way to see telemetry as well as
offering an example of the query to see that data. Use the query as a starting point
to build powerful dashboards.

Monitor the system
Dashboards are provided to monitor the health and performance of the different subsystems. They can be found under the Mir folder of the provided Grafana. There is a dashboard for each supporting infrastructure and services as well as overviews of the overall system health and performance. All the data are pulled from the Prometheus server used by Mir.
Moreover, Grafana allows you to create different alerts and notifications to keep you informed about any issues or anomalies in the system. You can set up alerts for specific metrics or conditions, and Grafana will notify you via email, Slack, or other channels when the alert is triggered.

Securing Mir
Overview
Security is paramount in IoT deployments, where devices, data, and infrastructure must be protected from unauthorized access, data breaches, and cyber attacks. Mir IoT Hub implements a comprehensive, defense-in-depth security strategy that addresses authentication, authorization, encryption, and auditing across the entire platform.
This section provides practical guides for implementing and managing security in your Mir deployment, from development environments to production-grade zero-trust architectures.
Security Architecture
Mir’s security model is built on three foundational pillars:
1. Authentication & Authorization (Auth)
Identity verification and access control through NATS JWT-based security:
- JWT Token Authentication: Every entity requires signed JWT credentials
- Role-Based Access Control (RBAC): Predefined roles for devices, operators, and modules
- Granular Permissions: Subject-based publish/subscribe authorization
- Credential Management: Automated rotation and distribution via NSC integration
2. Transport Layer Security (TLS)
Encryption and certificate-based authentication for all network communications:
- Server-Only TLS: One-way authentication with encrypted channels
- Mutual TLS (mTLS): Bidirectional certificate authentication
- Certificate Management: Support for self-signed and CA-signed certificates
- Flexible Configuration: Per-environment security requirements
3. Audit & Compliance
Comprehensive logging and event tracking for security monitoring:
- Event Store: All system events logged to SurrealDB
- Audit Trail: Complete history of device actions and configuration changes
- Monitoring Integration: Grafana dashboards for security metrics
- Compliance Support: Structured logs for regulatory requirements
Security Layers
┌─────────────────────────────────────────────┐
│           Application Layer                 │
│  - JWT Authentication                       │
│  - Role-Based Access Control                │
│  - Subject-Based Authorization              │
├─────────────────────────────────────────────┤
│           Transport Layer                   │
│  - TLS/mTLS Encryption                      │
│  - Certificate Validation                   │
│  - Secure NATS Messaging                    │
├─────────────────────────────────────────────┤
│           Infrastructure Layer              │
│  - Kubernetes Secrets                       │
│  - Network Policies                         │
│  - Container Security                       │
└─────────────────────────────────────────────┘
Implementation Guides
Authentication & Authorization
Implement JWT-based security for your Mir deployment:
- Authentication Overview: Understanding NATS security in Mir
- Docker Authentication: Secure your Docker Compose deployment
- Kubernetes Authentication: Enterprise-grade auth for K8s
Key concepts:
- Operator hierarchy with accounts and users
- Device-specific permissions to minimize attack surface
- Client access levels (standard, read-only, swarm)
- Module permissions for server-side components
Transport Layer Security
Encrypt all communications with TLS:
- TLS Overview: Choose between Server-Only and Mutual TLS
- Server-Only TLS: Simpler setup for trusted networks
- Mutual TLS: Zero-trust security with client certificates
Decision factors:
- Development vs. production requirements
- Certificate management complexity
- Compliance and regulatory needs
- Performance considerations
Next Steps
-
Start with Authentication: Begin by implementing JWT-based authentication for your deployment type
-
Add Transport Security: Layer on TLS encryption based on your security requirements
Authentication and Authorization
Mir IoT Hub implements comprehensive security through NATS authentication and authorization mechanisms. Every connection to the NATS requires valid JWT and NKeys credentials, ensuring a zero-trust security model. Security is managed with the tool NSC.
Nats Security is a large ecosystem with a lot of complexity, controls and features. To help secure your devices and users, Mir encapsulate some of the configuration and provides tooling to help. Nonetheless, operating Mir at a large scale would require to get more familiar with Nats Security ecosystem and NSC tool.
Key Security Features
- JWT-based authentication using ed25519 nkeys
- Role-based access control with predefined user types
- Granular subject-based authorization
- Credential rotation and management through CLI
How NATS Security Works
Authentication Flow
- Operator Creation: An operator (root authority) is created with signing keys
- Account Management: Accounts are created under the operator for logical separation
- User Generation: Users (devices, clients, modules) are created with specific permissions
- Credential Distribution: JWT credentials are generated and distributed to entities
- Connection Validation: NATS server validates JWT on each connection
Authorization Model
NATS uses subject-based permissions where each subject follows a hierarchical pattern:
device.{deviceId}.{module}.{version}.{function}
client.{clientId}.{module}.{version}.{function}
event.{type}.{deviceId}
Permissions are granted using allow/deny rules for publish (pub) and subscribe (sub) operations. To help navigate scopes, Mir offers a set of premade scopes for devices, clients and modules. Using NSC, you can create your own specific scope taylored to your need.
NSC Integration
Mir provides seamless integration with NSC (NATS Security CLI) to simplify credential management. The integration is exposed through the mir tools security command suite.
Operating Mir at a large scale would require to get more familiar with Nats Security ecosystem and NSC tool.
NSC Architecture
NSC manages a hierarchical structure of operators, accounts, and users:
Operator (Root Authority)
├── System Account (Internal Operations)
└── Default Account (Mir Operations)
    ├── Device Users
    │   ├── sensor001
    │   ├── sensor002
    │   └── ...
    ├── Client Users
    │   ├── operator-alice
    │   ├── viewer-bob
    │   └── ...
    └── Module Users
        ├── core
        ├── prototlm
        └── ...
NSC Commands via Mir CLI
Mir wraps NSC functionality with simplified commands:
- Initialize operators
- Generate Server configuration
- Add Users with predefined permissions
- Generate credential files
For advanced scenarios, you can use NSC directly.
User Types and Permissions
Mir defines three primary user types with specific permission sets:
1. Device Users
Devices have restricted permissions to prevent compromise:
# Device-specific permissions
--allow-pubsub _INBOX.>           # Required for request-reply
--allow-pub device.{deviceId}.>   # Publish telemetry/configuration/hearthbeat
--allow-sub {deviceId}.>          # Receive commands/config
2. Client Users
Three levels of client access:
Standard Client:
--allow-pubsub _INBOX.>
--allow-pub client.*.>  # All client operations
Read-Only Client:
--allow-pubsub _INBOX.>
--allow-pub client.*.core.v1alpa.list  # List devices only
--allow-pub client.*.cfg.v1alpha.list   # List configurations
--allow-pub client.*.cmd.v1alpha.list   # List commands
--allow-pub client.*.tlm.v1alpha.list   # List telemetry
--allow-pub client.*.evt.v1alpha.list   # List events
Swarm Client (Development or Demo):
--allow-pubsub _INBOX.>
--allow-pub client.*.>  # Client operations
--allow-pub device.*.>  # Device simulation
--allow-sub *.>
3. Module Users
Server-side modules with comprehensive access:
--allow-pubsub _INBOX.>
--allow-pubsub client.*.>  # Handle client requests
--allow-pubsub event.*.>   # Process events
--allow-sub device.*.>     # Monitor device data
--allow-pub *.>            # System-wide publishing
Next Steps
Based on your infrastructure, follow the appropriate guide:
- Docker Authentication Setup: Step-by-step guide for securing Docker Compose deployments with JWT authentication
- Kubernetes Authentication Setup: Enterprise-grade authentication configuration for Kubernetes environments
Securing your Docker deployment
Prerequisites
Install required security tools:
- NSC
mir tools install
Have a mir deployment ready to be used:
Setup
Mir Security CLI wraps NSC commands with a set of preset to make securing Mir ecoystem easier. It offers a set of basic commands to manipulate credentials. Moreover, it offers premade scope for the three types of users in Mir:
- Modules (server components)
- Clients (access CLI and other frontend)
- Devices (connect devices)
The CLI uses the current context to help manage which server to target. Use mir tools config edit to add a new context with server name and url:
# If using local setup
- name: local
  target: nats://localhost:4222
  webTarget: ws://localhost:9222
  grafana: localhost:3000
  sec:
    credentials: ""
    password: ""
You can overwrite the Operator, Account and URL arguments using flags. This requires more familiarity with the NSC tool. Moreover, you can use flag --no-exec on each command to see NSC commands.
Step 1: Initialize Mir Operator
Create a new NATS operator for your deployment:
mir tools security init
This creates:
- Operator signing keys
- Default account named Mir
- System account for internal operations
Step 2: Configure NATS Server
Generate Resolver Configuration used to launch Nats Server:
# Generate NATS resolver configuration
mir tools security generate-resolver -p ./resolver.conf
Update NATS Configuration
Edit ./mir-compose/natsio/config.conf and uncomment or add this line include resolver.conf.
Start server docker compose up.
The server is now running with authorization. To validate, run mir device ls and you should see nats: Authorization Violation. Similar for the logs of Mir server.
Moreover, if you run mir tools sec list accounts you should see two accounts: SYS and mir.
Step 3: Create Module Credentials
Let’s get the Mir server up & running by generating credentials taylored for it.
# Create new user of type Module
mir tools security add module mir_srv
# Sync user with server
mir tools security push
# Create credentials file for it
mir tools security generate-creds mir_srv -p ./mir_srv.creds
Now let’s launch the server with the credentials file. Edit ./mir-compose/mir/local-config.yaml and set the path under nats.credentials. Edit ./mir-compose/mir/compose.yaml to mount the file.
nats:
  url: "nats://local_mir_support-nats-1:4222"
  credentials: "/home/mir/creds/mir_srv.creds"
# Restart server
docker compose down
docker compose up
You should see a successfull connection without any errors.
Step 4: Create Client Credentials
Let’s create a Client credentials to have full access to the system.
# Create new user of type Client
# use -h to see options
mir tools security add client ops --swarm
# Sync user with server
mir tools security push
# Generate credentials
mir tools security generate-creds ops -p ./ops.creds
Edit CLI configuration file to add the credentials mir tools config edit:
- name: local
  target: nats://localhost:4222
  webTarget: ws://localhost:9222
  grafana: localhost:3000
  sec:
    credentials: <path>/ops.creds
If you run mir dev ls, you should now see the list of devices.
Step 5: Configure Cockpit Server List
Cockpit reads available contexts from ./mir-compose/mir/local-contexts.yaml (mounted into the container as cli.yaml) and exposes them to the browser via GET /api/v1/contexts. Each context entry defines a server the web UI can connect to.
Edit ./mir-compose/mir/local-contexts.yaml to list your servers:
logLevel: info
currentContext: local
contexts:
  - name: local
    target: nats://localhost:4222
    webTarget: ws://localhost:9222
    grafana: localhost:3000
    sec:
      credentials: ""
      password: ""
If you want to connect to a secure nats server. Mount the .creds file, set the path and a password.
contexts:
  - name: production
    target: nats://prod.example.com:4222
    webTarget: wss://prod.example.com:9222
    grafana: prod.example.com:3000
    sec:
      credentials: "/home/mir/creds/ops.creds"
      password: "your-secret-password"
Restart to apply: docker compose down && docker compose up.
Step 6: Create Device Credentials
The last type of users is of Device type. Refer to Integrating Mir to create a device.
# Create new user of type Device
# add --wildcard to have the same credentials for all devices.
# Else it is bound to this device id.
mir tools security add device dev1
# Sync user with server
mir tools security push
# Generate credentials
mir tools security generate-creds dev1 -p ./dev1.creds
There are a few options to load the credentials file with the DeviceSDK.
# Using Builder with fix path
device := mir.NewDevice().
    WithTarget("nats://nats.example.com:4222").
    WithCredentials("/<path>/dev1.creds").
    WithDeviceId("dev1").
    Build()
# Using Builder with default lookup
#   ./device.creds
#   ~/.config/mir/device.creds
#   /etc/mir/device.creds
device := mir.NewDevice().
    WithTarget("nats://nats.example.com:4222").
    DefaultUserCredentialsFile().
    Build()
It is also possible to load the credentials from the config file:
# Using Builder with config file
device := mir.NewDevice().
    WithTarget("nats://nats.example.com:4222").
    DefaultConfigFile().
    Build()
mir:
  credentials: "<path>/dev1.creds"
  device:
    id: "dev1"
Run the device and no auth errors should be displayed. Now run mir dev ls and you should see:
➜ mir dev ls
NAMESPACE/NAME                                DEVICE_ID        STATUS     LAST_HEARTHBEAT      LAST_SCHEMA_FETCH    LABELS
default/dev1                                  dev1             online     2025-09-18 16:16:27  2025-09-18 16:15:18
Other commands
# View current operator configuration
mir tools security env

# Sync with remote credential store
mir tools security push
mir tools security pull

# List users
mir tools security list [operators|accounts|users]
Summary
Mir’s integration with NATS security provides:
- Strong authentication using JWT and nkeys
- Flexible authorization with subject-based permissions
- Simple management through the Mir CLI
- Production-ready security model for IoT deployments
For additional security features, see:
- TLS Configuration for encrypted connections
- Security Overview for comprehensive security architecture
Securing your Kubernetes deployment
Prerequisites
Install required security tools:
- NSC
mir tools install
Have a mir deployment ready to be used:
Setup
Mir Security CLI wraps NSC commands with a set of preset to make securing Mir ecoystem easier. It offers a set of basic commands to manipulate credentials. Moreover, it offers premade scope for the three types of users in Mir:
- Modules (server components)
- Clients (access CLI and other frontend)
- Devices (connect devices)
The CLI uses the current context to help manage which server to target. Use mir tools config edit to add a new context with server name and url:
# If using local k3d
- name: k3d
  target: nats://localhost:31422
  grafana: grafana-local:8081
You can overwrite the Operator, Account and URL arguments using flags. This requires more familiarity with the NSC tool. Moreover, you can use flag --no-exec on each command to see NSC commands.
Step 1: Initialize Mir Operator
Create a new NATS operator for your deployment:
mir tools security init
This creates:
- Operator signing keys
- Default account named Mir
- System account for internal operations
Step 2: Configure NATS Server
Generate Resolver Configuration used to launch Nats Server:
# Generate NATS resolver configuration
mir tools security generate-resolver -p ./resolver.conf
Using Values file
Replace the OPERATOR_JWT, SYS_ACCOUNT_ID, and SYS_ACCOUNT_JWT with your values. Make sure that you do not include the trailing , in the SYS_ACCOUNT_JWT.
# values-auth.yaml
## Nats Config
nats:
  config:
    resolver:
      enabled: true
      merge:
        type: full
        interval: 2m
        timeout: 1.9s
    merge:
      operator: OPERATOR_JWT
      system_account: SYS_ACCOUNT_ID
      resolver_preload:
        SYS_ACCOUNT_ID: SYS_ACCOUNT_JWT
Using Secret
To use a secret instead, we need to transform the resolver.conf as a Kubernetes secret:
# Directly to the cluster
kubectl create secret generic mir-resolver-secret --from-file=resolver.conf
# As file
kubectl create secret generic mir-resolver-secret --from-file=resolver.conf --dry-run=client -o yaml > mir-resolver.secret.yaml
Alternatively, you can use the --kubernetes flag to combine credetials and secret creation:
mir tools security generate-resolver -p ./mir-resolver.secret.yaml --kubernetes
We create a new volume to mount the file and then we refer the secret. Update <MIR_RESOLVER_SECRET> with your secret name.
nats:
  config:
    resolver:
      enabled: true
      merge:
        type: full
        interval: 2m
        timeout: 1.9s
    merge:
      $include: ../nats-auth/resolver.conf
  container:
    patch:
    - op: add
      path: /volumeMounts/-
      value:
        name: nats-auth-include
        mountPath: /etc/nats-auth/
  podTemplate:
    patch:
    - op: add
      path: /spec/volumes/-
      value:
        name: nats-auth-include
        secret:
          secretName: <MIR_RESOLVER_SECRET>
The server will now be running with authorization.
Step 3: Create Module Credentials
Let’s get the Mir server up & running by generating credentials taylored for it.
# Create new user of type Module
mir tools security add module mir_srv
# Sync user with server
mir tools security push
# Create credentials file for it
mir tools security generate-creds mir_srv -p ./mir_srv.creds
Now time to create the Kubernetes Secret and Configure the Mir Server with it.
# Directly to the cluster
kubectl create secret generic mir-auth-secret --from-file=mir.creds=mir_srv.creds
# As file
kubectl create secret generic mir-auth-secret --from-file=mir.creds=mir_srv.creds --dry-run=client -o yaml > mir-auth.secret.yaml
# Note: the key `mir.creds` is required
Alternatively, you can use the --kubernetes flag to combine credetials and secret creation:
mir tools security generate-creds mir_srv -p ./mir-auth.secret.yaml --kubernetes
Finally, let’s refer the secret in the values-auth.yaml and restart the server:
# values-auth.yaml
## Nats Config
nats:
  config:
    resolver:
      enabled: true
      merge:
        type: full
        interval: 2m
        timeout: 1.9s
  ...

## Mir Server
authSecretRef: "mir-auth-secret"
Start server using helm [install|upgrade] <name> <path> -f values-auth.yaml.
You should see a successfull connection withour any errors from the Mir Server pod.
To validate authorization is probably setup, run mir device ls and you should see nats: Authorization Violation.
Step 4: Create Client Credentials
Let’s create a Client credentials to have full access to the system.
# Create new user of type Client
# use -h to see options
mir tools security add client ops --swarm
# Sync user with server
mir tools security push
# Generate credentials
mir tools security generate-creds ops -p ./ops.creds
Edit CLI configuration file to add the credentials mir tools config edit:
- name: local
  target: nats://localhost:4222
  grafana: localhost:3000
  credentials: <path>/ops.creds
If you run mir dev ls, you should now see the list of devices.
Step 5: Create Device Credentials
The last type of users is of Device type. Refer to Integrating Mir to create a device.
# Create new user of type Device
# add --wildcard to have the same credentials for all devices.
# Else it is bound to this device id.
mir tools security add device dev1
# Sync user with server
mir tools security push
# Generate credentials
mir tools security generate-creds dev1 -p ./dev1.creds
There are a few options to load the credentials file with the DeviceSDK.
# Using Builder with fix path
device := mir.NewDevice().
    WithTarget("nats://nats.example.com:4222").
    WithCredentials("/<path>/dev1.creds").
    WithDeviceId("dev1").
    Build()
# Using Builder with default lookup
#   ./device.creds
#   ~/.config/mir/device.creds
#   /etc/mir/device.creds
device := mir.NewDevice().
    WithTarget("nats://nats.example.com:4222").
    DefaultUserCredentialsFile().
    Build()
It is also possible to load the credentials from the config file:
# Using Builder with config file
device := mir.NewDevice().
    WithTarget("nats://nats.example.com:4222").
    DefaultConfigFile().
    Build()
mir:
  credentials: "<path>/dev1.creds"
  device:
    id: "dev1"
Run the device and no auth errors should be displayed. Now run mir dev ls and you should see:
➜ mir dev ls
NAMESPACE/NAME                                DEVICE_ID        STATUS     LAST_HEARTHBEAT      LAST_SCHEMA_FETCH    LABELS
default/dev1                                  dev1             online     2025-09-18 16:16:27  2025-09-18 16:15:18
Step 6: Configure Cockpit Context Credentials
The Cockpit web UI connects to NATS on behalf of the browser. When a context requires authentication, the Mir server serves the .creds file to the browser via POST /api/v1/credentials?context=<name>. You can optionally protect this endpoint with a password gate.
Context credentials file
Option A - Reuse the Mir server credentials
If all contexts share the same access level as the Mir server itself, point the context at the file already mounted via authSecretRef:
# values-auth.yaml
config:
  contexts:
    - name: "production"
      sec:
        credentials: "/etc/mir/mir.creds"
Option B - Dedicated Cockpit client credentials
Gives the Cockpit a separate NATS user with its own scope, independent from the server’s module user.
# Create client users for each context
mir tools security add client production_ui --swarm
mir tools security add client staging_ui --swarm
mir tools security push
mir tools security generate-creds production_ui -p ./production.creds
mir tools security generate-creds staging_ui -p ./staging.creds
All context credentials can share a single Kubernetes secret, use a separate key per context:
kubectl create secret generic mir-cockpit-creds \
  --from-file=production.creds=./production.creds \
  --from-file=staging.creds=./staging.creds
Reference the shared secret in values, pointing each context at its own key via credsSecretKey:
# values-auth.yaml
config:
  contexts:
    - name: "production"
      sec:
        credsSecretRef: "mir-cockpit-creds"
        credsSecretKey: "production.creds"   # auto-mounts at /etc/mir/creds/production.creds
    - name: "staging"
      sec:
        credsSecretRef: "mir-cockpit-creds"
        credsSecretKey: "staging.creds"      # auto-mounts at /etc/mir/creds/staging.creds
If you only have one context, credsSecretKey defaults to mir.creds, so you can omit it:
kubectl create secret generic mir-cockpit-creds --from-file=mir.creds=./cockpit_ui.creds
Both options can be combined with a password gate (see below).
Context password gate
Add per-context passwords to the existing mir-secret (the secret referenced by secretRef) rather than putting them in plaintext values. The key pattern is MIR__CTX__<UPPERCASE_NAME>__PASSWORD - hyphens in context names become underscores.
# mir.secret.yaml
apiVersion: v1
kind: Secret
metadata:
  name: mir-secret
type: Opaque
stringData:
  MIR__SURREAL__PASSWORD: "root"
  MIR__INFLUX__TOKEN: "mir-operator-token"
  # Cockpit context passwords
  MIR__CTX__PRODUCTION__PASSWORD: "your-cockpit-password"
  # For a context named "prod-eu": MIR__CTX__PROD_EU__PASSWORD: "..."
Apply and reference in values:
kubectl apply -f mir.secret.yaml
# values-auth.yaml
secretRef: "mir-secret"
Restart the deployment to pick up the new secret keys. In the Cockpit, selecting a secured context will now prompt for the password before returning credentials to the browser.
Other commands
# View current operator configuration
mir tools security env
# Sync with remote credential store
mir tools security push
mir tools security pull
# List users
mir tools security list [operators|accounts|users]
Summary
Mir’s integration with NATS security provides:
- Strong authentication using JWT and nkeys
- Flexible authorization with subject-based permissions
- Simple management through the Mir CLI
- Production-ready security model for IoT deployments
For additional security features, see:
- TLS Configuration for encrypted connections
- Security Overview for comprehensive security architecture
TLS
Overview
Transport Layer Security (TLS) is a cryptographic protocol that provides secure communication over networks. In the Mir IoT Hub ecosystem, TLS is used to secure the NATS messaging bus, ensuring that all communication between devices, modules, and clients is encrypted and authenticated.
Why TLS for IoT?
IoT systems like Mir face unique security challenges:
- Device Authentication: Ensuring only authorized devices can connect to your infrastructure
- Data Confidentiality: Protecting telemetry, commands, and configuration data in transit
- Network Integrity: Preventing man-in-the-middle attacks and data tampering
- Compliance: Meeting industry security standards and regulations
TLS addresses these challenges by providing encryption, authentication, and data integrity for all NATS communications in your Mir deployment.
TLS Components
Certificate Authority (CA)
The root of trust that signs and validates all certificates in your system. The CA certificate must be distributed to all clients to verify server authenticity.
Server Certificate
Issued by the CA, this certificate identifies the NATS server and enables clients to verify they’re connecting to the legitimate server.
Client Certificate (mTLS only)
In Mutual TLS configurations, clients also present certificates to the server, enabling bidirectional authentication.
Server-Only TLS
Server-Only TLS provides one-way authentication where:
- The server presents its certificate to prove its identity
- The client verifies the server’s certificate using the CA
- Communication is encrypted, but clients are not authenticated via certificates
When to Use Server-Only TLS
- Simpler deployment with fewer certificates to manage
- Clients authenticate through other means (credentials, tokens)
- Internal networks with additional security layers
- Development and testing environments
Security Considerations
- Clients must securely store the CA certificate
- Additional authentication mechanisms needed for clients
- Suitable when client identity verification is handled at the application layer
→ Server-Only TLS Implementation Guide
Mutual TLS (mTLS)
Mutual TLS provides two-way authentication where:
- The server presents its certificate and verifies client certificates
- The client presents its certificate and verifies the server’s certificate
- Both parties authenticate each other before establishing connection
When to Use Mutual TLS
- Zero-trust security environments
- Production deployments with strict security requirements
- When certificate-based client authentication is preferred
- Regulatory compliance requirements (HIPAA, PCI-DSS, etc.)
Security Benefits
- Strong bidirectional authentication without passwords
- Each client has a unique identity via its certificate
- Compromised credentials can be revoked immediately
- No shared secrets or passwords transmitted
→ Mutual TLS Implementation Guide
Choosing Between Server-Only and Mutual TLS
| Aspect | Server-Only TLS | Mutual TLS |
|---|---|---|
| Authentication | Server only | Bidirectional |
| Certificate Management | Minimal (CA + Server) | Complex (CA + Server + All Clients) |
| Setup Complexity | Simple | More Complex |
| Client Identity | Via credentials/tokens | Via certificates |
| Security Level | Good | Excellent |
| Use Case | Development, Internal Networks, Production | Production, Zero-Trust |
| Revocation | N/A for clients | Per-client revocation |
| Compliance | Basic security requirements | Strict regulatory requirements |
Best Practices
- Certificate Rotation: Plan for regular certificate renewal before expiration
- Secure Storage: Store private keys securely, never commit to version control
- Unique Certificates: In mTLS, assign unique certificates per client for granular control
- Monitoring: Set up alerts for certificate expiration
- Documentation: Maintain clear documentation of your certificate infrastructure
Next Steps
Choose your TLS implementation based on your security requirements:
-
Server-Only TLS Guide: Simpler setup with server authentication only. Ideal for development environments, internal deployments and less strict security environment.
-
Mutual TLS Guide: Complete bidirectional authentication using certificates. Recommended for production environments and zero-trust architectures.
Both guides provide step-by-step instructions for Docker Compose and Kubernetes deployments, including certificate generation, server configuration, and client setup for CLI, Devices, and Modules.
Server Only TLS
Prerequisites
Have certificates on hands:
- bring your own or use OpenSSL
Have a mir deployment ready to be used:
Steps
If you have your own, skip to Step 2.
Step 1: Generate certificates
This will:
- generate a CA private key and certificate
- the certificate must be installed on Mir clients (CLI, Devices, Modules)
- generate a Server private key and certificate.
- must be passed on Nats Message Bus
- sign the Server certificate with the CA
# Generating CA private key
openssl genrsa -out ca.key 4096
# Generating CA certificate
openssl req -new -x509 -days 3650 -key ca.key -out ca.crt \
-subj "/C=US/ST=CA/L=San Francisco/O=NATS Demo/OU=Certificate Authority/CN=NATS Root CA" \
2>/dev/null
# Generating Server private key
openssl genrsa -out tls.key 4096
# Generating Server certificate
openssl req -new -key tls.key -out server.csr \
-subj "/C=US/ST=CA/L=San Francisco/O=NATS Demo/OU=NATS Server/CN=localhost" \
2>/dev/null
# Create extensions file for SAN (Subject Alternative Names)
# Make sure to put the address of your server
cat > server-ext.cnf <<EOF
subjectAltName = DNS:localhost,DNS:*.localhost,DNS:local-nats,IP:127.0.0.1,IP:::1
EOF
# Sign the server certificate
openssl x509 -req -days 365 -in server.csr -CA ca.crt -CAkey ca.key \
-CAcreateserial -out tls.crt -extfile server-ext.cnf 2>/dev/null
Step 2: Configure Nats Server
Docker
Copy tls.crt and tls.key under ./mir-compose/natsio/certs.
In the ./mir-compose/natsio/config.conf, update with the following:
# TLS/Security
tls: {
cert_file: "/etc/nats/certs/tls.crt"
key_file: "/etc/nats/certs/tls.key"
timeout: 2
}
Update Compose to pass the certificates:
services:
nats:
...
volumes:
...
- ./certs:/etc/nats/certs
...
Start server docker compose up.
Kubernetes
Create a Kubernetes Secret with the TLS:
# Directly to the cluster
kubectl create secret tls mir-tls-secret --cert=tls.crt --key=tls.key
# As file
kubectl create secret tls mir-tls-secret --cert=tls.crt --key=tls.key -o yaml --dry-run=client > mir-tls.secret.yaml
Update values file:
## Nats
nats:
config:
nats:
tls:
enabled: true
secretName: mir-tls-secret # Secret name
dir: /etc/nats-certs/nats
cert: tls.crt
key: tls.key
merge:
verify: false # false = Server-Only TLS (no client cert required)
timeout: 2
Step 3: Configure Cockpit HTTPS (Optional)
By default Cockpit serves on plain HTTP. If you want the web UI over HTTPS (so the browser uses wss:// for its NATS WebSocket connection), follow the steps for your deployment.
Docker
Configure in ./mir-compose/mir/local-config.yaml:
mir:
http:
port: 3015
tlsCert: "/home/mir/certs/tls.crt"
tlsKey: "/home/mir/certs/tls.key"
Mount the certs into the Mir container in ./mir-compose/mir/compose.yaml:
services:
mir:
volumes:
- ./local-config.yaml:/home/mir/.config/mir/mir.yaml
- ./local-contexts.yaml:/home/mir/.config/mir/cli.yaml
- ./certs:/home/mir/certs
Update ./mir-compose/mir/local-contexts.yaml so Cockpit connects over secure WebSocket:
contexts:
- name: local
target: nats+tls://localhost:4222
webTarget: wss://localhost:9222 # Note 'wss' to enable secured connection
grafana: localhost:3000
Restart: docker compose down && docker compose up. Cockpit is now available at https://localhost:3015.
Kubernetes
Option A and B are mutually exclusive. With ingress TLS (Option A), NATS WebSocket TLS is terminated at the ingress. Without ingress (Option B), NATS WebSocket must serve TLS directly.
Option A - Via Ingress (recommended)
The ingress controller terminates TLS. Mir and NATS run plain HTTP/WS internally.
kubectl create secret tls mir-http-tls-secret --cert=tls.crt --key=tls.key
ingress:
enabled: true
className: "traefik" # or "nginx", etc.
hosts:
- host: mir.example.com
paths:
- path: /
pathType: Prefix
tls:
- secretName: mir-http-tls-secret
hosts:
- mir.example.com
nats:
config:
websocket:
ingress:
enabled: true
hosts:
- mir.example.com
path: /nats-ws
pathType: Prefix
className: "traefik"
tlsSecretName: mir-http-tls-secret
config:
contexts:
- name: "production"
webTarget: "wss://mir.example.com/nats-ws"
Option B - Via App (no ingress)
Mir and NATS serve TLS directly. Use when there is no ingress controller.
kubectl create secret tls mir-http-tls-secret --cert=tls.crt --key=tls.key
kubectl create secret tls nats-ws-tls-secret --cert=tls.crt --key=tls.key
mirHttpTlsSecretRef: mir-http-tls-secret
nats:
config:
websocket:
tls:
enabled: true
secretName: nats-ws-tls-secret
dir: /etc/nats-certs/websocket
cert: tls.crt
key: tls.key
config:
contexts:
- name: "production"
webTarget: "wss://<host>:31922" # NATS WebSocket NodePort
Apply with Helm:
helm upgrade <release-name> <chart-path> -f values.yaml
Step 4: Install Root Certificate on Module
If the CA Certificate is public and installed in the Trusted Store of your container, you can skip this step.
Docker
Edit ./mir-compose/mir/local-config.yaml and set the root CA path under nats.rootCA. Mount the file in ./mir-compose/mir/compose.yaml.
nats:
url: "nats+tls://local_mir_support-nats-1:4222"
rootCA: "/home/mir/certs/ca.crt"
# Restart server
docker compose down
docker compose up
Kubernetes
Create a Kubernetes Secret with the RootCA:
# Directly to the cluster
kubectl create secret generic mir-rootca-secret --from-file=ca.crt
# As file
kubectl create secret generic mir-rootca-secret --from-file=ca.crt -o yaml --dry-run=client > mir-rootca.secret.yaml
Update values file:
## MIR
caSecretRef: mir-rootca-secret # Secret name
Step 5: Install the Root Certificate on the Clients
If the CA Certificate is public and installed in the Trusted Store of your machine, you can skip this step.
Via the Trusted Store
If installed in the Trusted Store, Applications automaticly use them to identify servers.
Each OS has different install location and steps. Describing each one of them is out the scope of this documentaton.
Steps for ArchLinux:
# 1. Copy CA to anchors
sudo cp ca.crt /etc/ca-certificates/trust-source/anchors/nats-ca.crt
# 2. Ensure correct permissions
sudo chmod 644 /etc/ca-certificates/trust-source/anchors/nats-ca.crt
# 3. Update trust database
sudo update-ca-trust extract
# 4. Verify
trust list | grep "NATS Root CA"
Via Configuration
If you prefer not too use the Trusted Store, you can pass the CA certificate directly in the Mir applications.
CLI
Edit CLI configuration file to add the RootCA mir tools config edit:
- name: local
target: nats://localhost:4222
webTarget: wss://localhost:9222
grafana: localhost:3000
sec:
rootCA: <path>/ca.crt
Device
There are a few options to load the RootCA file with the DeviceSDK.
# Using Builder with fix path
device := mir.NewDevice().
WithTarget("nats://nats.example.com:4222").
WithRootCA("/<path>/ca.crt").
WithDeviceId("dev1").
Build()
# Using Builder with default lookup
# ./ca.crt
# ~/.config/mir/ca.crt
# /etc/mir/ca.crt
device := mir.NewDevice().
WithTarget("nats://nats.example.com:4222").
DefaultRootCA().
Build()
It is also possible to load the RootCA from the config file:
# Using Builder with config file
device := mir.NewDevice().
WithTarget("nats://nats.example.com:4222").
DefaultConfigFile().
Build()
mir:
rootCA: "<path>/ca.crt"
device:
id: "dev1"
Run the device and no TLS errors should be displayed. Now run mir dev ls and you should see:
➜ mir dev ls
NAMESPACE/NAME DEVICE_ID STATUS LAST_HEARTHBEAT LAST_SCHEMA_FETCH LABELS
default/dev1 dev1 online 2025-09-18 16:16:27 2025-09-18 16:15:18
Completed
Congratulation, you now have ServerOnly TLS configured.
Mutual TLS
Prerequisites
Have certificates on hands:
- bring your own or use OpenSSL
Have a mir deployment ready to be used:
Steps
If you have your own, skip to Step 2.
Step 1: Generate certificates
This will:
- generate a CA private key and certificate
- the certificate must be installed on Mir clients (CLI, Devices, Modules)
- generate a Server private key and certificate and sign with CA
- must be passed on Nats Message Bus
- generate multiple Client private keys and certificates and sign with CA
- one for Mir Server
- one for each operator (CLI)
- one for each devices
# Generating CA private key
openssl genrsa -out ca.key 4096 2>/dev/null
# Generating CA certificate
openssl req -new -x509 -days 3650 -key ca.key -out ca.crt \
-subj "/C=US/ST=CA/L=San Francisco/O=Mir IoT/OU=Certificate Authority/CN=Mir Root CA" \
2>/dev/null
# Generating Server private key
openssl genrsa -out tls.key 4096 2>/dev/null
# Generating Server certificate request
openssl req -new -key tls.key -out server.csr \
-subj "/C=US/ST=CA/L=San Francisco/O=Mir IoT/OU=NATS Server/CN=localhost" \
2>/dev/null
# Create extensions file for SAN (Subject Alternative Names)
# ! Add your Host or IP to the list
cat > server-ext.cnf <<EOF
subjectAltName = DNS:localhost,DNS:*.localhost,DNS:local-nats,DNS:nats,IP:127.0.0.1,IP:::1
EOF
# Sign the server certificate
openssl x509 -req -days 365 -in server.csr -CA ca.crt -CAkey ca.key \
-CAcreateserial -out tls.crt -extfile server-ext.cnf 2>/dev/null
# Clean up
rm -f server.csr server-ext.cnf
# Generating Mir Module client private key
openssl genrsa -out mir-module.key 4096 2>/dev/null
# Generating Mir Module client certificate request
openssl req -new -key mir-module.key -out mir-module.csr \
-subj "/C=US/ST=CA/L=San Francisco/O=Mir IoT/OU=Services/CN=mir-module" \
2>/dev/null
# Sign the Mir Module client certificate
openssl x509 -req -days 365 -in mir-module.csr \
-CA ca.crt -CAkey ca.key -CAcreateserial \
-out mir-module.crt 2>/dev/null
# Clean up
rm -f mir-module.csr
# Generating CLI client private key
openssl genrsa -out mir-cli.key 4096 2>/dev/null
# Generating CLI client certificate request
openssl req -new -key mir-cli.key -out mir-cli.csr \
-subj "/C=US/ST=CA/L=San Francisco/O=Mir IoT/OU=Operators/CN=mir-cli" \
2>/dev/null
# Sign the CLI client certificate
openssl x509 -req -days 365 -in mir-cli.csr \
-CA ca.crt -CAkey ca.key -CAcreateserial \
-out mir-cli.crt 2>/dev/null
# Clean up
rm -f mir-cli.csr
# Generating Device client private key
openssl genrsa -out mir-device.key 4096 2>/dev/null
# Generating Device client certificate request
openssl req -new -key mir-device.key -out mir-device.csr \
-subj "/C=US/ST=CA/L=San Francisco/O=Mir IoT/OU=Devices/CN=mir-device-001" \
2>/dev/null
# Sign the Device client certificate
openssl x509 -req -days 365 -in mir-device.csr \
-CA ca.crt -CAkey ca.key -CAcreateserial \
-out mir-device.crt 2>/dev/null
Step 2: Configure Nats Server
Docker
Copy ca.crt, tls.crt and tls.key under ./mir-compose/natsio/certs.
In the ./mir-compose/natsio/config.conf, update with the following:
# TLS/Security
tls: {
cert_file: "/etc/nats/certs/tls.crt"
key_file: "/etc/nats/certs/tls.key"
# Required for mTLS
ca_file: "/etc/nats/certs/ca.crt"
verify: true
timeout: 2
}
# WebSocket Configuration with TLS
websocket: {
listen: 0.0.0.0:9222
tls: {
cert_file: "/etc/nats/certs/tls.crt"
key_file: "/etc/nats/certs/tls.key"
}
no_tls: false
compress: true
}
Update Compose to pass the certificates:
services:
nats:
...
volumes:
...
- ./certs:/etc/nats/certs
...
Start server docker compose up.
Kubernetes
Create two Kubernetes Secrets, CA and TLS:
# Directly to the cluster
kubectl create secret tls nats-tls-secret --cert=tls.crt --key=tls.key
kubectl create secret generic nats-ca-secret --from-file=ca.crt=ca.crt
# As file
kubectl create secret tls nats-tls-secret --cert=tls.crt --key=tls.key -o yaml --dry-run=client > nats-tls.secret.yaml
kubectl create secret generic nats-ca-secret --from-file=ca.crt=ca.crt -o yaml --dry-run=client > nats-ca.secret.yaml
Update values file:
## NATS
nats:
config:
nats:
tls:
enabled: true
secretName: nats-tls-secret
dir: /etc/nats-certs
cert: tls.crt
key: tls.key
merge:
verify: true # True for Mutual TLS, false for ServerOnly TLS
timeout: 2
# Reference CA for mTLS
tlsCA:
enabled: true
secretName: nats-ca-secret
dir: /etc/nats-ca-certs
key: ca.crt
Step 3: Configure Cockpit HTTPS (Optional)
By default Cockpit serves on plain HTTP. If you want the web UI over HTTPS (so the browser uses wss:// for its NATS WebSocket connection), follow the steps for your deployment.
Docker
Configure in ./mir-compose/mir/local-config.yaml:
mir:
http:
port: 3015
tlsCert: "/home/mir/certs/tls.crt"
tlsKey: "/home/mir/certs/tls.key"
Mount the certs into the Mir container in ./mir-compose/mir/compose.yaml:
services:
mir:
volumes:
- ./local-config.yaml:/home/mir/.config/mir/mir.yaml
- ./local-contexts.yaml:/home/mir/.config/mir/cli.yaml
- ./certs:/home/mir/certs
Update ./mir-compose/mir/local-contexts.yaml so Cockpit connects over secure WebSocket:
contexts:
- name: local
target: nats+tls://localhost:4222
webTarget: wss://localhost:9222 # Note 'wss' for secure connection
grafana: localhost:3000
Restart: docker compose down && docker compose up. Cockpit is now available at https://localhost:3015.
Kubernetes
Option A and B are mutually exclusive. With ingress TLS (Option A), NATS WebSocket TLS is terminated at the ingress. Without ingress (Option B), NATS WebSocket must serve TLS directly. Mutual TLS is not supported for browser clients.
Option A - Via Ingress (recommended)
The ingress controller terminates TLS. Mir and NATS run plain HTTP/WS internally.
kubectl create secret tls mir-http-tls-secret --cert=tls.crt --key=tls.key
ingress:
enabled: true
className: "traefik" # or "nginx", etc.
hosts:
- host: mir.example.com
paths:
- path: /
pathType: Prefix
tls:
- secretName: mir-http-tls-secret
hosts:
- mir.example.com
nats:
config:
websocket:
ingress:
enabled: true
hosts:
- mir.example.com
path: /nats-ws
pathType: Prefix
className: "traefik"
tlsSecretName: mir-http-tls-secret
config:
contexts:
- name: "production"
webTarget: "wss://mir.example.com/nats-ws"
Option B - Via App (no ingress)
Mir and NATS serve TLS directly. Use when there is no ingress controller.
kubectl create secret tls mir-http-tls-secret --cert=tls.crt --key=tls.key
kubectl create secret tls nats-ws-tls-secret --cert=tls.crt --key=tls.key
mirHttpTlsSecretRef: mir-http-tls-secret
nats:
config:
websocket:
tls:
enabled: true
secretName: nats-ws-tls-secret
dir: /etc/nats-certs/websocket
cert: tls.crt
key: tls.key
config:
contexts:
- name: "production"
webTarget: "wss://<host>:31922" # NATS WebSocket NodePort
Apply with Helm:
helm upgrade <release-name> <chart-path> -f values.yaml
Step 4: Install Certificates on Module
Docker
Edit ./mir-compose/mir/local-config.yaml with the RootCA, certificate and private key paths under nats.*. Mount the files in ./mir-compose/mir/compose.yaml.
nats:
url: "nats+tls://local_mir_support-nats-1:4222"
rootCA: "/home/mir/certs/ca.crt"
tlsCert: "/home/mir/certs/mir-module.crt"
tlsKey: "/home/mir/certs/mir-module.key"
# Restart server
docker compose down
docker compose up
Kubernetes
Create two Kubernetes Secret, CA and TLS:
# Directly to the cluster
kubectl create secret tls mir-tls-secret --cert=tls.crt --key=tls.key
kubectl create secret generic mir-ca-secret --from-file=ca.crt=ca.crt
# As file
kubectl create secret tls mir-tls-secret --cert=tls.crt --key=tls.key -o yaml --dry-run=client > mir-tls.secret.yaml
kubectl create secret generic mir-ca-secret --from-file=ca.crt=ca.crt -o yaml --dry-run=client > mir-ca.secret.yaml
Update values file:
## MIR
caSecretRef: mir-ca-secret
tlsSecretRef: mir-tls-secret
Step 5: Install the Certificates on the Clients
CLI
Edit CLI configuration file to add the RootCA mir tools config edit:
- name: local
target: nats+tls://localhost:4222
webTarget: wss://localhost:9222
grafana: localhost:3000
sec:
rootCA: <path>/ca.crt
tlsKey: <path>/mir-cli.key
tlsCert: <path>/mir-cli.crt
Run mir dev ls to validate.
Device
There are a few options to load the RootCA and Certificate files with the DeviceSDK.
# Using Builder with fix path
device := mir.Builder().
RootCA("/<path>/ca.crt").
ClientCertificateFile("/<path>/mir-device.crt", "/<path>/mir-device.key").
DeviceId("dev1").
Build()
# Using Builder with default lookup
# ./ca.crt
# ~/.config/mir/ca.crt
# /etc/mir/ca.crt
#
# ./tls.crt & ./tls.key
# ~/.config/mir/tls.crt & ~/.config/mir/tls.key
# /etc/mir/tls.crt & /etc/mir/tls.key
device := mir.NewDevice().
Target("nats://nats.example.com:4222").
DefaultRootCAFile().
DefaultClientCertificateFile().
Build()
It is also possible to load the RootCA from the config file:
# Using Builder with config file
device := mir.Builder().
DefaultConfigFile().
Build()
mir:
rootCA: "<path>/ca.crt"
tlsKey: "<path>/mir-device.key"
tlsCert: "<path>/mir-device.crt"
device:
id: "dev1"
Run the device and no TLS errors should be displayed. Now run mir dev ls and you should see:
➜ mir dev ls
NAMESPACE/NAME DEVICE_ID STATUS LAST_HEARTHBEAT LAST_SCHEMA_FETCH LABELS
default/dev1 dev1 online 2025-09-18 16:16:27 2025-09-18 16:15:18
Completed
Congratulation, you now have Mutual TLS configured.
Roadmap
v0.1.0
The main goals of the v0.1.0 is to get the uncertainties out of the way, implement basic functionnalities and create the tools to help on this adventure
- a proof of concept for the Protoproxy as their is much incertainties about the feasibility of that one
- Core module to manage devices
- CLI to easily interact with the system via bash and scripts
- TUI to easiliy interac with the system via a fun user experience
- Go Device SDK to create basic devices
Features
-
Create a poc of ProtoProxy which can listen Nats and push to db
- Need to create store library
- Create store server
- need to select db [questdb]
- need to deploy db [docker compose]
- Need to create the deserialize library to line protocol
- use unit test to validate
- Need to deploy NatsIO [docker compose]
- Need to create a NatsIO library
- Need to create to pipe the natsio telemetry to the db through protoproxy
- Deploy Questdb and connect
- Add metrics to protoproxy
- Add dashboard for protoproxy
- Add dashboard for natsio
- Add metrics endpoint for prometheus, nodeexporter, natsio, questdb
- Configure a grafana with questdb and prometheus data source
- Add dashboard to see telemetry
- Need to create store library
-
Core, register new device and basic management. The Core.
- Create a new device
- Update a device
- Delete a device
- List all devices with labels filter
- Get a device or a list of device with list of ids
- Setup unit test boilerplate
- Setup unit test for each functions
- Setup SurrealDB
- Setup NatsIO and request reply paradigm
- Add unit test with sub test and better handle db close
- Add search by annotations
- Add search by any json fields
- Add custom set of Mir errors for nice and consistent error handling
- Comment the protofile
- Added heartbeat functionality
-
MirCLI, the Command Line Interface to easy interact with the system and with scripts
- Basic functionallity to manage devices
- Create a database seeding script for populating the db
- Add name field to device
-
MirTUI, the Terminal User Interface with bubble tea
- Learn BubbleTea
- Create the general parent layout
- Create basic components like tooltip and toast
- Create main page layout
- Create the list device layouts
- Create the create device page layout
- Create the edit device page layout
- Delete a device function
-
MirGoSdk, device sdk in Go
-
Create builder or Option patterns for sdk
-
Have Heartbeat functionality implemented
-
Config and Logging setup
-
Design the event system
- How to publish new event
- How to catch those events
- ServerSide SDK
Improvements/Tech dett
Ergonomics
v0.2.0 Telemetry module
The main goals of this version is to create the Telemetry module as well as the visualizing tools for the data
Features
Server Module
- ProtoFlux, handle telemetry data from protobuf to line protocol
CLI/TUI
- Upload schema via CLI
- Schema explorer via CLI and maybe TUI
- Create ProtoDash which can generate a dashboard from a proto file
Device SDK
- Custom Protobuff annotation for Mir System
- Added telemetry function to the SDK
Module SDK
- Add new set of events regarding telemetry
- Add stream subscriptions
Testing
- Integration test for the telemetry module
Improvements/Tech dett
- Project layout refactor
- Decoupling of storage and server handlers
- rework how boiler template of app is made for services
- same tool for cli could be used for bootstrap of service
- change how init is used to become more main and have a run method
- Set config in a mir folder instead of per apps
- where is the line between using code and a spec? maybe enforcing a spec is sufficient instead of creating a maze of code abstraction for it -
- merge tui and cli into one binary
Ergonomics
- Create tmuxifier layouts in repo
- Make command for buf generate
v0.3.0 Command Module
The main goal of this version is the create the Commanding module as well as the supporting tooling and visualization
Features
Server Module
- Can define commands in protobuf schema
- Send command with Targets and JSON payload to target multiple devices
CLI/TUI
- Explore commands
- Be able to send commands via window with parameters based on the schema
Device SDK
- Custom Protobuff annotation for Mir System for commands
- Added commands handler to the SDK
Module SDK
- Add new set of events regarding commands
Testing
- Integration test for the command module
Improvements/Tech dett
Ergonomics
Testing
Improvements/Tech dett
Ergonomics
v0.4.0 Twin Module
Twin module to tackle the configuration mangement of devices. Flow of desired properties set by the user and reported properties set by the device.
Features
Server Module
- Can define properties in protobuf schema or maybe JSON is better since it will be hard with the twin template
CLI/TUI
- Can update and list configurations
Device SDK
- Custom Protobuff annotation for Mir System for properties
- Add desired properties handler to the SDK
- Add reported properties function
Module SDK
- Add new set of events regarding propeties
- create the twin template features
Testing
Improvements/Tech dett
Ergonomics
v0.5.0 DeviceSDK and ModuleSDK Improvements
The goal is too focus on SDK requirements or QOL that are not bound to a module
Features
Device SDK
- Add local storage for message in case of network outage
- Add the ability to publish to custom routes
- Add autoprovisioner of device id such as mac address
Module SDK
- Add the ability to subscribe to custome route
- Look at replacing SurrealDB with NatsIO Keyvalue or Badger
Testing
Improvements/Tech dett
Ergonomics
v0.6.0
The main goal of this version is to focus on the deployment and production toolings such as pipeline and conternarization
Features
Testing
- Add env var for integration test if run
Improvements/Tech dett
Ergonomics
DevOps
-
Containerize all services
-
Provide template container for sdk
-
Create Docker Compose for each and one all together
-
Create set of pipelines for unit and integration testing
-
Pipeline to release binaries of each interfaces or services
-
Pipeline for publishing containers
-
Make sure the sdks are available via go get/install
v0.7.0 Swarm
Create a utility tool to virtualize devices. This will be used for extensive integration and performance testing to increase reliability and performance
Features
Testing
Improvements/Tech dett
Ergonomics
Access Mir Binary and SDK from private repository
Since the repository is private, you need to adjust your Git and Go configuration before you can access the sdk or install the CLI. The goal is to be able to run those commands:
# Install CLI
go install github.com/maxthom/mir/cmds/mir@latest
# Import DeviceSDK to your project
go get github.com/maxthom/mir/
First, make sure you have access to the repository on GitHub and your local env. is setup with an SSH key for authentication.
Second, we need to tell Go to use the SSH protocol instead of HTTP to access the GitHub repository so it can pass credentials.
# In ~/.gitconfig
[url "ssh://git@github.com/maxthom/mir"]
insteadOf = https://github.com/maxthom/mir
Even though Go packages are stored in Git repositories, they get downloaded through Go mirror. Therefore, we must tell Go to download it directly from the Git repository.
go env -w GOPRIVATE=github.com/maxthom/mir
If any import match the pattern github.com/maxthom/mir/*, Go will download the package directly from the Git repository.
Now, you can run
# CLI
go install github.com/maxthom/mir/cmds/mir@latest
# DeviceSDK
go get github.com/maxthom/mir/
You are now ready to access the Mir repository.
Access Mir Container Registry
The Mir container images are hosted on GitHub Container Registry (ghcr.io). This guide explains how to authenticate and pull Mir images.
Prerequisites
- Docker
- Invited in the Mir Repository
Authentication Required
The Mir container images are hosted in a private GitHub Container Registry. You must authenticate to pull images:
# Authentication is required before pulling
docker login ghcr.io
# Then pull the image
docker pull ghcr.io/maxthom/mir:latest
Creating a GitHub Personal Access Token
Step 1: Navigate to GitHub Settings
- Log in to your GitHub account
- Click your profile picture in the top-right corner
- Select Settings from the dropdown menu
Step 2: Access Developer Settings
- Scroll down to the bottom of the left sidebar
- Click Developer settings
Step 3: Create Personal Access Token
-
Click Personal access tokens → Tokens (classic)
-
Click Generate new token → Generate new token (classic)
-
Give your token a descriptive name (e.g., “Mir Container Registry”)
-
Set an expiration date (or select “No expiration” for permanent tokens)
-
Select the following scopes:
read:packages- Download packages from GitHub Package Registry
-
Click Generate token
-
Important: Copy your token immediately. You won’t be able to see it again!
Alternative: Fine-grained Personal Access Token
For enhanced security, use a fine-grained token:
- Click Personal access tokens → Fine-grained tokens
- Click Generate new token
- Set token name and expiration
- Under Repository access, select:
- “Selected repositories” and choose
maxthom/mir - Or “All repositories” if you need broader access
- “Selected repositories” and choose
- Under Permissions → Repository permissions:
- Set Packages to “Read” (or “Write” if needed)
- Click Generate token
Container Registry Login
Using Personal Access Token
# Set your GitHub username and token
export GITHUB_USER="your-github-username"
export GITHUB_TOKEN="ghp_xxxxxxxxxxxxxxxxxxxx"
# Login to GitHub Container Registry
echo $GITHUB_TOKEN | docker login ghcr.io -u $GITHUB_USER --password-stdin
# Interactive login:
docker login ghcr.io
# Username: your-github-username
# Password: your-personal-access-token
Verify Authentication
# Test authentication by pulling an image
docker pull ghcr.io/maxthom/mir:latest
Kubernetes Secret for Image Pull
Create Secret for Kubernetes
# Create namespace if needed
kubectl create namespace mir
# Create docker-registry secret
kubectl create secret docker-registry ghcr-mir-secret \
--docker-server=ghcr.io \
--docker-username=$GITHUB_USER \
--docker-password=$GITHUB_TOKEN \
--docker-email=your-email@example.com \
--namespace=mir
Use in Deployment
Add to your Helm values file:
imagePullSecrets:
- name: ghcr-mir-secret
Additional Resources
- GitHub Container Registry Documentation
- GitHub Personal Access Tokens
- Docker Login Documentation
- Kubernetes Image Pull Secrets
Software Ergonomics: Why Developer Experience is the Foundation of Great User Experience
As we develop software, we want to deliver products with a good user experience. In reality, most softwares greatly lack in user experience as we focus too much on performance and the rest becomes an afterthought. Software developpers need to focus on bringing back a great UX and to achieve that we need to put back the most important users in the center: the developers themselves.
This oversight creates a cascade of problems: overwhelm by complex systems, endless urgent support work that keeps on increasing, tools that fight against us, hypersiloization of team members. In short, developers lose joy in their craft and morale plummets, leading to employee dissatisfaction, resignations, and increased tribal knowledge. The remaining team members face mounting pressure while managers scramble through interview cycles, creating a downward spiral that ultimately results into productivity and delivery slowdown and lower product quality. New hires come in and the integration is challenging, difficult and draining. Lost in all the ecosystems, colleagues are overwhelmed and can’t help out. The new hires, often young developers, wonder if it’s their fault increasing their sense of imposter syndromes.
How can we ensure morale and joy stay up? It all begins with the workbench.
Years ago, in one aerospace company I worked for, we hired a new manufacturing floor head engineer to help boost productivity. He was quick to point out that in many work stations, the workers had their backs bent constantly. Within a week, all the stations were corrected. His first few months were all about the ergonomics of the workstations for the employees; the results were transformative. Staff morale increased and the trust they had for their manager allowed them to give their opinion, resulting in a ton of changes. That year, they reached production goals that the previous manufacturing head could not.
How can we translate this to Software? Here comes Software Ergonomics or simply DX for Developer Experience.
The Golden Rule: One command, Start to work
The first thing to focus on, like the head of the manufacturing floor, is the workstation of the developers. It needs to be optimized by building the required tools and environment to allow good and clean workflow. Whether for development or operations, everything should follow one simple principle: one command, start to work.
The goal is for developers to have everything they need to work at their fingertips with minimal setup. This includes tooling, supporting infrastructure, services, configuration, documentation, seeding, etc.
Eliminate Tooling Friction
The first barrier to productivity is often the tools themselves. Projects frequently require numerous complicated tools that are difficult to install and use, creating an unnecessary barrier to entry. Remember, developers have varying levels of expertise: some excel at OS level while others don’t, some are juniors while others are seniors, and some view computer science as life while others see it just as a job.
A solution is to provide automatic tool installation through:
- Install scripts attached to each project
- Dev containers that encapsulate the entire development environment
- Debian (or other) packages containing all necessary binaries for development and operations
This approach removes barriers and lets developers focus on learning the tools and integrating with their team workflow, regardless of their experience level. Being able to install all the required tools with just one command, speeds up the setup process dramatically improving productivity.
Conquer Setup Complexity
Modern software systems are dependency nightmares: databases, message buses, cloud services, and swarms of interconnected services. This complexity creates productivity bottlenecks during startup and context-switching, making work feel like climbing a mountain before you can even begin.
It leads to employees avoiding work on certain projects or always pushing it off. Even harder when a project is left untouched for weeks or months and you have to “dust it off”. Never mind new hires who barely know the company ecosystem. With time, it leads to increased siloization of individuals as some projects are too complex. Documentation or setup steps tend to be obselete and scattered all over the place if they even exist.
Our approach is to include everything needed in the repository with local-first design:
- Docker Compose infrastructure: Launch supporting services with one command. Each container must be configured properly on localhost and integrated with the local code and other services.
- Local code: Each service default configuration should be set up on localhost and work with the supporting infrastructure seamlessly.
- Hot reloading: File watchers that restart services as code changes
- Multiple workflow options: Tie everything together so it can be launched in one command: code, infrastructure, etc. Use Makefile/Justfile commands, TMUX scripts for terminal layouts, VS Code tasks, etc. It is important that each developer enjoys their preferred workflow.
The benefits cascade throughout the development lifecycle. New or returning developers onboard effortlessly instead of spending days fighting setup issues. Simple, smooth workflows keep teams engaged and motivated over time. Well-organized configuration becomes living documentation that teaches system architecture through hands-on experience. Most importantly, clean local setup patterns translate directly to production environments, reducing deployment issues and surprises.
The setup requires, as with anything, ongoing iteration as systems evolve, but the investment pays as well as provides many indirect benefits: team confidence, system understanding, and operational readiness—creating lasting advantages. Make this approach your own by using the tools and setup you like, but one command, start to work.
Lay the Operational Foundation Early
A critical mistake is treating operational concerns as an afterthought. Creating a proper Operation Experience (OX) for the operation teams whether is IT, DevOps or the developers themselves is as important then DX or UX. Operation teams must manage hundreds of different software systems, each with its own configuration approach, documentation quality, bugs, and community support. This easily leads to operational chaos and nightmares that drains productivity and morale. Therefore, it is essential that systems deliver excellent operations experience: Metrics & Dashboards, Structural Loggings, Health Endpoints, AutoReconnect between services, Configuration, Pipelines, etc.
All these elements are simple but impactful. They’re can be hard to retrofit due to required code changes, so add them early and evolve them with your system. It will help catch bugs and integration issues when they are the cheapest and easiest to fix. It will make the Operational Experience feel like a breeze increasing joy and ease of usage for both developers and operators.
Dashboards open your system
Provide system insights through solutions like Prometheus, Datadog or else. Implement them early, even without any interesting metrics as the setup will be ready as features are built. Build dashboards alongside the metrics and logs to make the information visible for developers, maintainers, and operators. Give insight into your system.
Documentation should live in your application
Documentation should live with your application, not on distant documentation platforms where it gets lost and forgotten. If the documentation live with the code, it can be improved and updated as the code changes. Make it part of merge or pull request. Moreover, many markdown-to-HTML solutions enable great documentation websites with markdown flexibility.
Pipelines keep the system in check
CI/CD is primordial in modern software but often left until the end or abandoned entirely.
I once had to integrate Python software from a company we bought into our ecosystem with a week deadline for an $17 million contract presentation. The published containers failed on startup, the codebase wouldn’t start locally, and the Dockerfile was broken. After a week of fixes, we discovered their pipeline had been broken for 9 months, required three repositories to run locally, and it needed my fixes to their Dockerfile and code base to run properly.
We managed to make it work with their team after a full week of hard work, but their software was sending the data in the wrong format so we had to cut them out of the presentation anyway.
CI pipelines should exist in early phases, even with just builds and dummy unit tests. It helps validate the reproductibility of the setup and is a source of documentation in itself. It will help catch bugs and integration issues immediately when they are the cheapest and easiest to fix. As the project progresses, you keep on adding to it: containers, testing, deployment, etc. The pipeline helps control and keep in check the evolution of the codebase.
Auto-Reconnect reduce operational pain
Your system is one of many that operations teams manage. It needs resilience against network failures, outages, and other issues. Auto-reconnect prevents cascading failures but needs early implementation as it can change code structure.
I once built a Kubernetes platform for a “ready” system of 5 sequential services and we had around 30 deployments. Each service was unstable and would crash often. When one crashed, others followed or became unrecoverable, requiring manual restart of each in proper order. Quickly, it became a huge pain to operate as well as greatly reduce trust with our user base. The solution was too add auto-reconnect: 4 services was simple, but the fifth took a month due to poor structure costing a lot of my time and the developers time.
From DX and OX to UX, Building Systems People Love to Use
In construction, architecture focuses on aesthetic design and how people live in the different spaces, while civil engineering handles technical feasibility and safety. In software, we teach architecture like civil engineering: design patterns, services, performance, etc. There is no focus on how developers, maintainers, operators and users live in that software space. The result is often an over-architected systems with poor usability and ergonomics for all user types.
In a previous job, a team managed data across hundreds of databases and S3 storage for engineering professionals company-wide. The complexity made it so difficult to manage and use, leading to the infamous company quote: “Where is my data?”. A UI was built to help users manage the data they needed, but eventually, the UI was removed from the hands of the users because it was too difficult to operate.
Built by a solo developer, most team members avoided developing or operating the platform. It was complicated, difficult to use, and joyless, leading to hyper-siloization and operational issues; including pulling the developer from vacation when problems arose. At this level, it was not the developer’s fault, but a leadership failure.
From this point, we have the basics covered to develop the system. It is easy to get into the workflow and we can be productive rapidly. As we develop the system, what do we do the most? Well, we use it! We trigger different things to test functionality: API endpoints, data seeding, complex button sequences. Try to remember the latest API you worked on, you problably had a complicated API with too many endpoints and too many parameters. In the end, even if you built the API or not, you struggle to use the system as a developer, get lost in the rapidly growing ecosystems and find it difficult to operate, and simply not fun. If we struggle as builders, how will users, operators and even other devs fare? Fast-foward a few months, it goes into production and you, users or operators struggle to use it. If you did build the API, you might be able to use it greatly, because you know it by heart but is it the case for your coworkers and users? This will greatly increase hypersiloization of you and your team members in their respective projects. You need to enjoy the tools you build, you need to bring joy to using your systems.
How do we get around this? We need to provide a user experience by providing flows, not just buttons and switches. As we reduced the barrier of entry to develop in a project, we need to do the same to operate it! To learn how to interact with our system, we need to take incremental steps from low level to high level: automatic testing, CLI and finally a full user interface.
Automatic Testing, Controlling Volatility
Automatic testing is quite the subject, with many approaches and philosophies, but it has a clear goal and it is not about finding bugs. Software evoles like writing a book: draft after draft, morphing as requirements changes and system grows. Design and architecture must adjust, leading to small or large refactors. Systems that reach crystallization point do so because developers cannot or fear refactoring. Automatic testing ensures system viability despite the necessary changes by giving you confidence to make the changes because the tests will always back you up.
Integrating tests into development might feel slow intially, but productivity enhances afterward. Treat tests as first class citizen! Take the the time to write test utilities and domain specific libraries. If your tests have a lot of boilerplate code, write helpers to it to make it easier. Writing test is as much part of a system as writing core code, you must find joy in it.
While writing tests, think beyond triggering API endpoints; start refining your thinking about the user’s workflow, about the CLI and the web/desktop interface. How will the users use the system? Which actions might trigger a few endpoints? Do you need new ones? Do you need to add parameters to existing ones? Take the time to adjust your API with the vision you’re building. As you work on the next step, you will be happy that the API is rock-solid and has everything you need to construct that vision.
With automatic testing as part of the development flow, you control a software’s volatility, find a lot of initial bugs and glitches and slowly build the vision for the user’s workflows.
CLI, The Stepping Stone
One of the most important thing is to enjoy using the software you are building. If you hate using your own software, you’ll build something that everyone else hates too. You create a cycle of not caring as you develop resulting in a poor craft. A CLI isn’t just a developer tool, it’s your first real user interface. It’s where you stop thinking like a backend engineer and start thinking like someone who actually has to get work done. Your CLI is higher-level than raw APIs but lower than a web app. It’s where those workflow ideas bouncing around your head while coding finally get tested in reality.
Most CLIs are lazy API wrappers; don’t do this. Your CLI should solve actual problems, not just expose endpoints. If your users always repeat a set of operations, combine them into one command. Make the commands interactive if needed, guide the users as they use the CLI. Using a CLI where you have to remember all the commands, the positional arguments and the flags is difficult and unpleasant, make them consistent accross commands. Make the CLI intuitive:
- Need login? Redirect to login automatically
- Need a JSON payload? Generate the template for them
- Need to understand what happened? Show them useful output, not cryptic success codes
What does the user need to accomplish a task and what do they want after they have run the command? Provide those.
Depending on the type of software you are writing, the CLI might become part of a lot of automation. Enable that by providing great integration with piping stdin and stdout through the different commands. For example, if a command needs a JSON payload in an argument, add piping to that argument with something like: cat payload.json | mir cmd send -n ActivateStartUpSeq. If your CLI is also the server, you should add commands to help its operation:
- Add a command to print the current configuration
- A command to create the default configuration file at the default location
- Display the loaded configuration (hide secrets) as logs as the software boots up and where it reads the config.
Operations and developers teams manage hundreds of tools. Make yours the one they don’t curse at. They will love those little details as they make things so much simpler. IT and DevOps engineers need to be part of the experience.
As you write your CLI, you will keep on building an understanding of the way you want your users to interact with your system which will help you in the design of the next step which is often a web application. Iterate on your API to make sure everything is there for the next step of your vision. A CLI will empower you and your team to operate the system faster, automate tasks, reduce support time and build a great quality product overall. As with everything else, a CLI can be iterated upon! Each new features should come with the new core code, automatic testing and CLI. When developers enjoy their tools, they build better products.
This podcast on CLI design offers deeper reflection on the subject: GoTime Podcast.
Conclusion
The path to exceptional user experience begins not with the end user, but with the developers sitting at their workstation. Just as with any manufacturing engineer, ergonomics including workbenches, tools, and workflows directly determine the quality of what we build. Software ergonomics isn’t just about making developers happy; it’s about creating a foundation for sustainable and high-quality software development. When developers struggle with complicated setup processes, fragmented tooling, and systems they themselves find difficult to use, that struggle inevitably propagates to the end product and employee dissatisfaction. The frustrated developer who dreads working on a particular system will not craft the elegant and user-friendly experience. Delight all your users, don’t just deliver code.
The incremental approach outlined, from “one command, start to work” to automated testing, CLI development, and finally to full user interfaces, creates a natural progression where each step builds understanding, confidence and a better user experience. This isn’t just about process; it’s about creating joy in the craft of software development. When developers enjoy using what they’re building, when they can easily demonstrate features to colleagues, when onboarding new team members becomes effortless rather than painful, the entire organization benefits. When the DX, OX or UX is not right, there will be disenchantment from every type of user and this creates a downward spiral: support work increases, joy decreases, siloization increases, etc. A beautiful UI does not help or resolve the underlying issues nor does technical perfection:
In my early days of programming, I worked in a car sharing company with some of the worst software I have ever seen: thousand lines functions, personal information such as credit cards, driver’s license numbers written plainly in the database, 800 tables in SQL with 0 foreign keys, and so much more and the UI wasn’t pretty either. Nonetheless, operators and users loved the system. Why? Because the developers were extremely close to the user base. You don’t need to be an expert developer, you just need to be attentive to your user base. Each developer and operator had each other’s back; teamwork makes the dream work. In retrospect, that carsharing company made among the best software system I have seen (after finally encrypting credit cards and personal information).
What matters most is the connection between builders and users. By combining a user-focused mindset with proper developer ergonomics, we can achieve both technical excellence and user satisfaction.
Investing time in developer tooling, ergonomics, and experience isn’t a distraction from “real work”, it’s what makes the real work possible, sustainable, and ultimately successful. Every minute spent improving the developer experience pays dividends in faster delivery, fewer bugs, better user experiences, and higher team morale. The most important users of your software system are the developers. When you take care of them, they’ll take care of everyone else. Start with your workbench, build incrementally, and watch as improved developer experience naturally evolves into exceptional user experience. Your future self, your teammates, and your users will thank you for it.
Here’s a little story I often relate: In Stephen Covey’s influential book “The 7 Habits of Highly Effective People,” the seventh habit is from the “Sharpen the Axe” story.
Two lumberjacks compete to cut the most trees in one day. The first worked non-stop without breaks, while the second worked for an hour then rested for ten minutes every hour. At the day’s end, the second lumberjack had cut far more trees. When the first asked how this was possible despite all the breaks, the second replied, “I wasn’t just taking break, I was sharpening my axe.”
The lesson for software engineers: taking breaks from big features to rest your mind, sharpen your skills and improve tooling isn’t slowing you down, it’s what ultimately makes you faster, more effective and gives you higher moral. Prioritise the development experience. Proper workbench and setup is about the culture it creates.
Artisans of an earlier age where proud to sign their work. You should be, too. - The Pragmatic Programmer, Page 485 -